March 29, 2024
(press release)
–
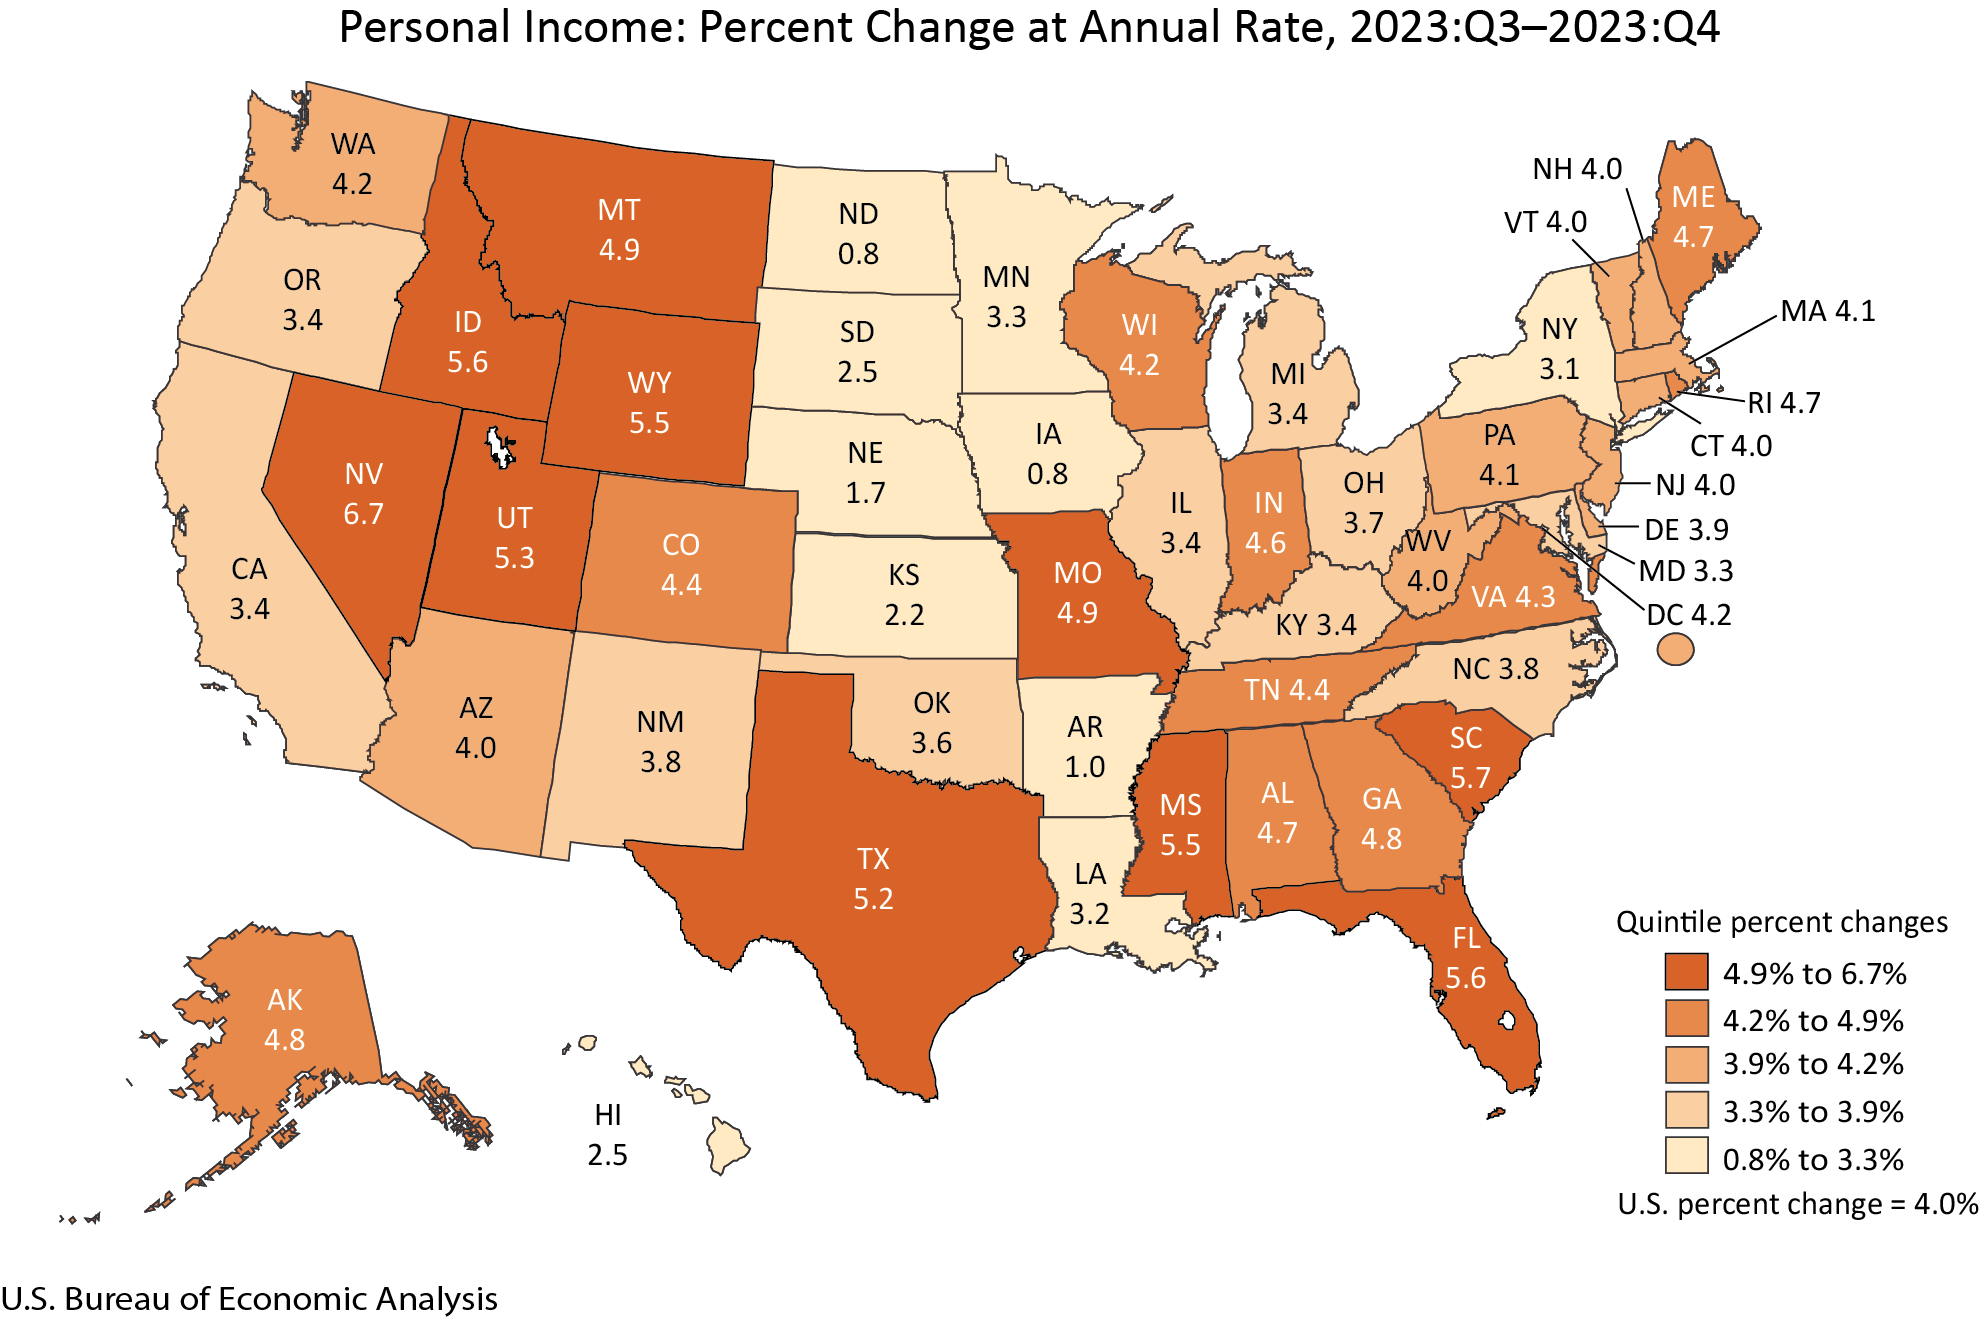
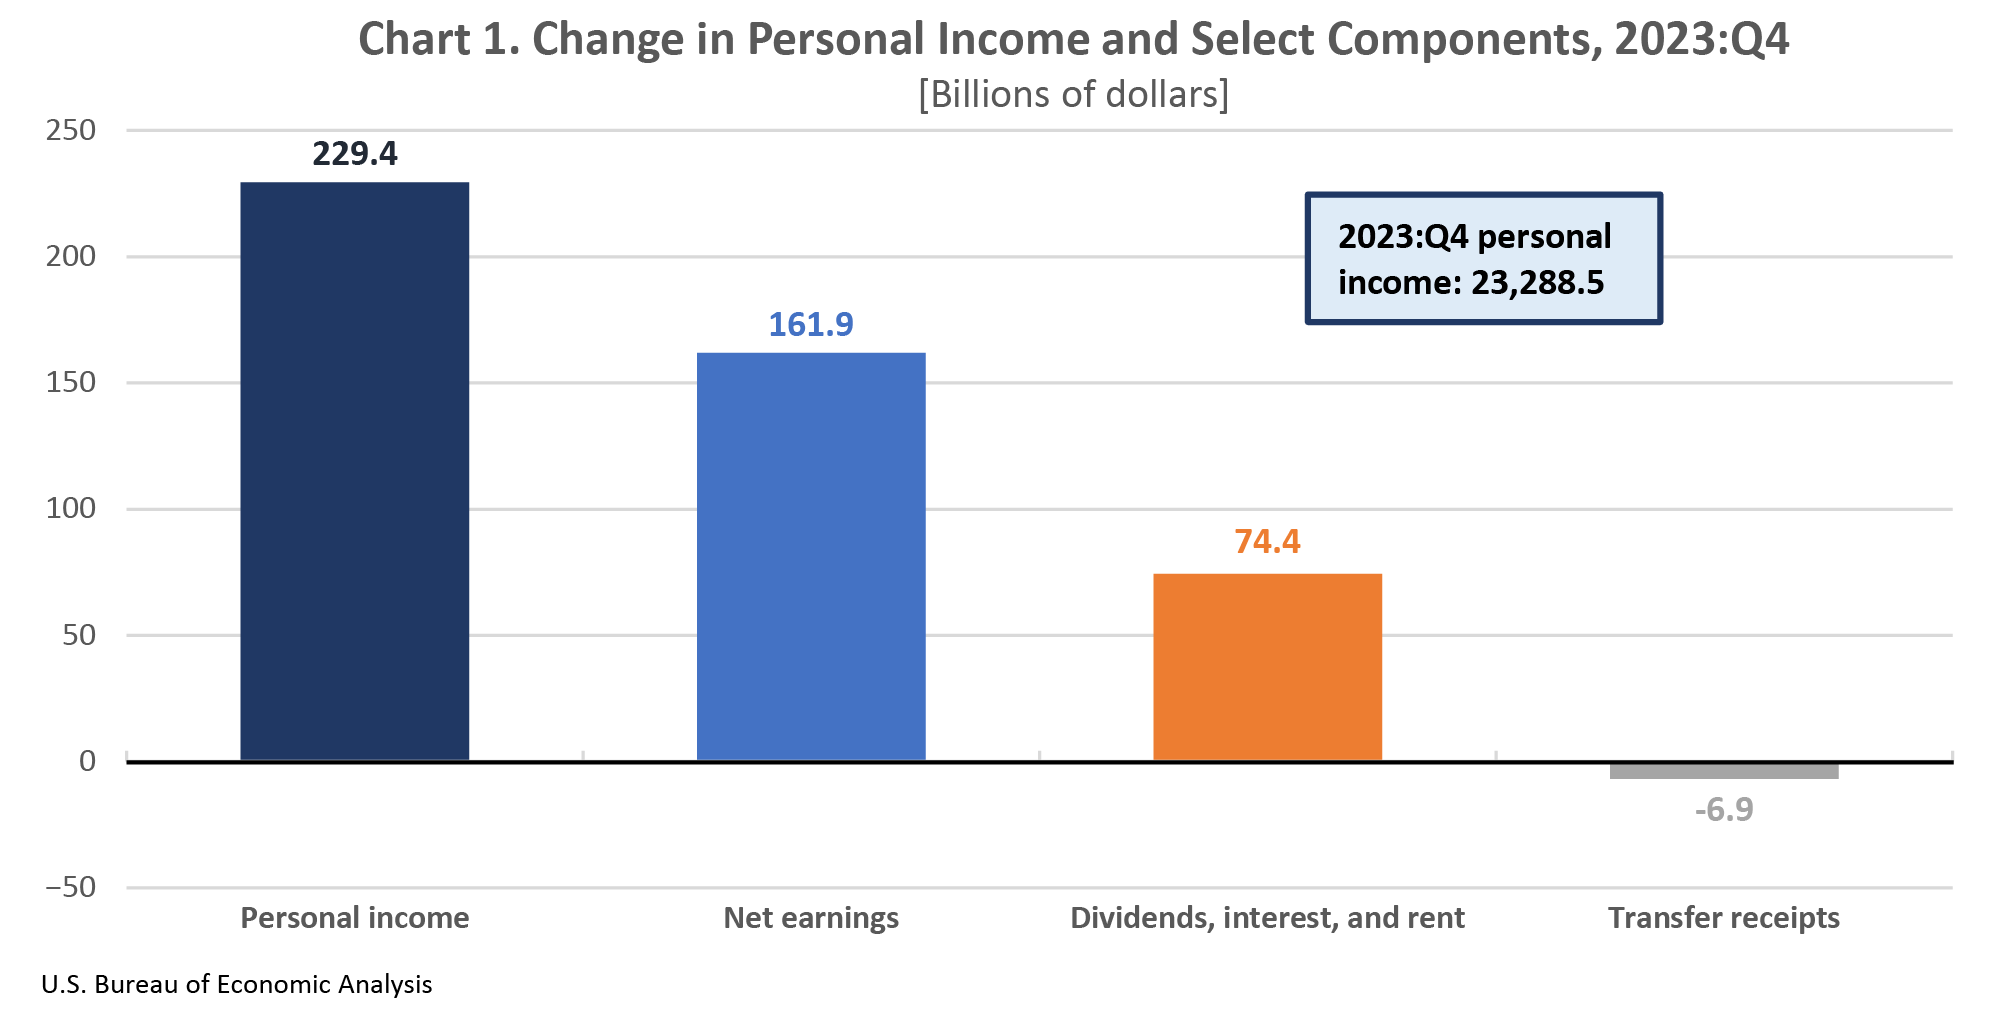
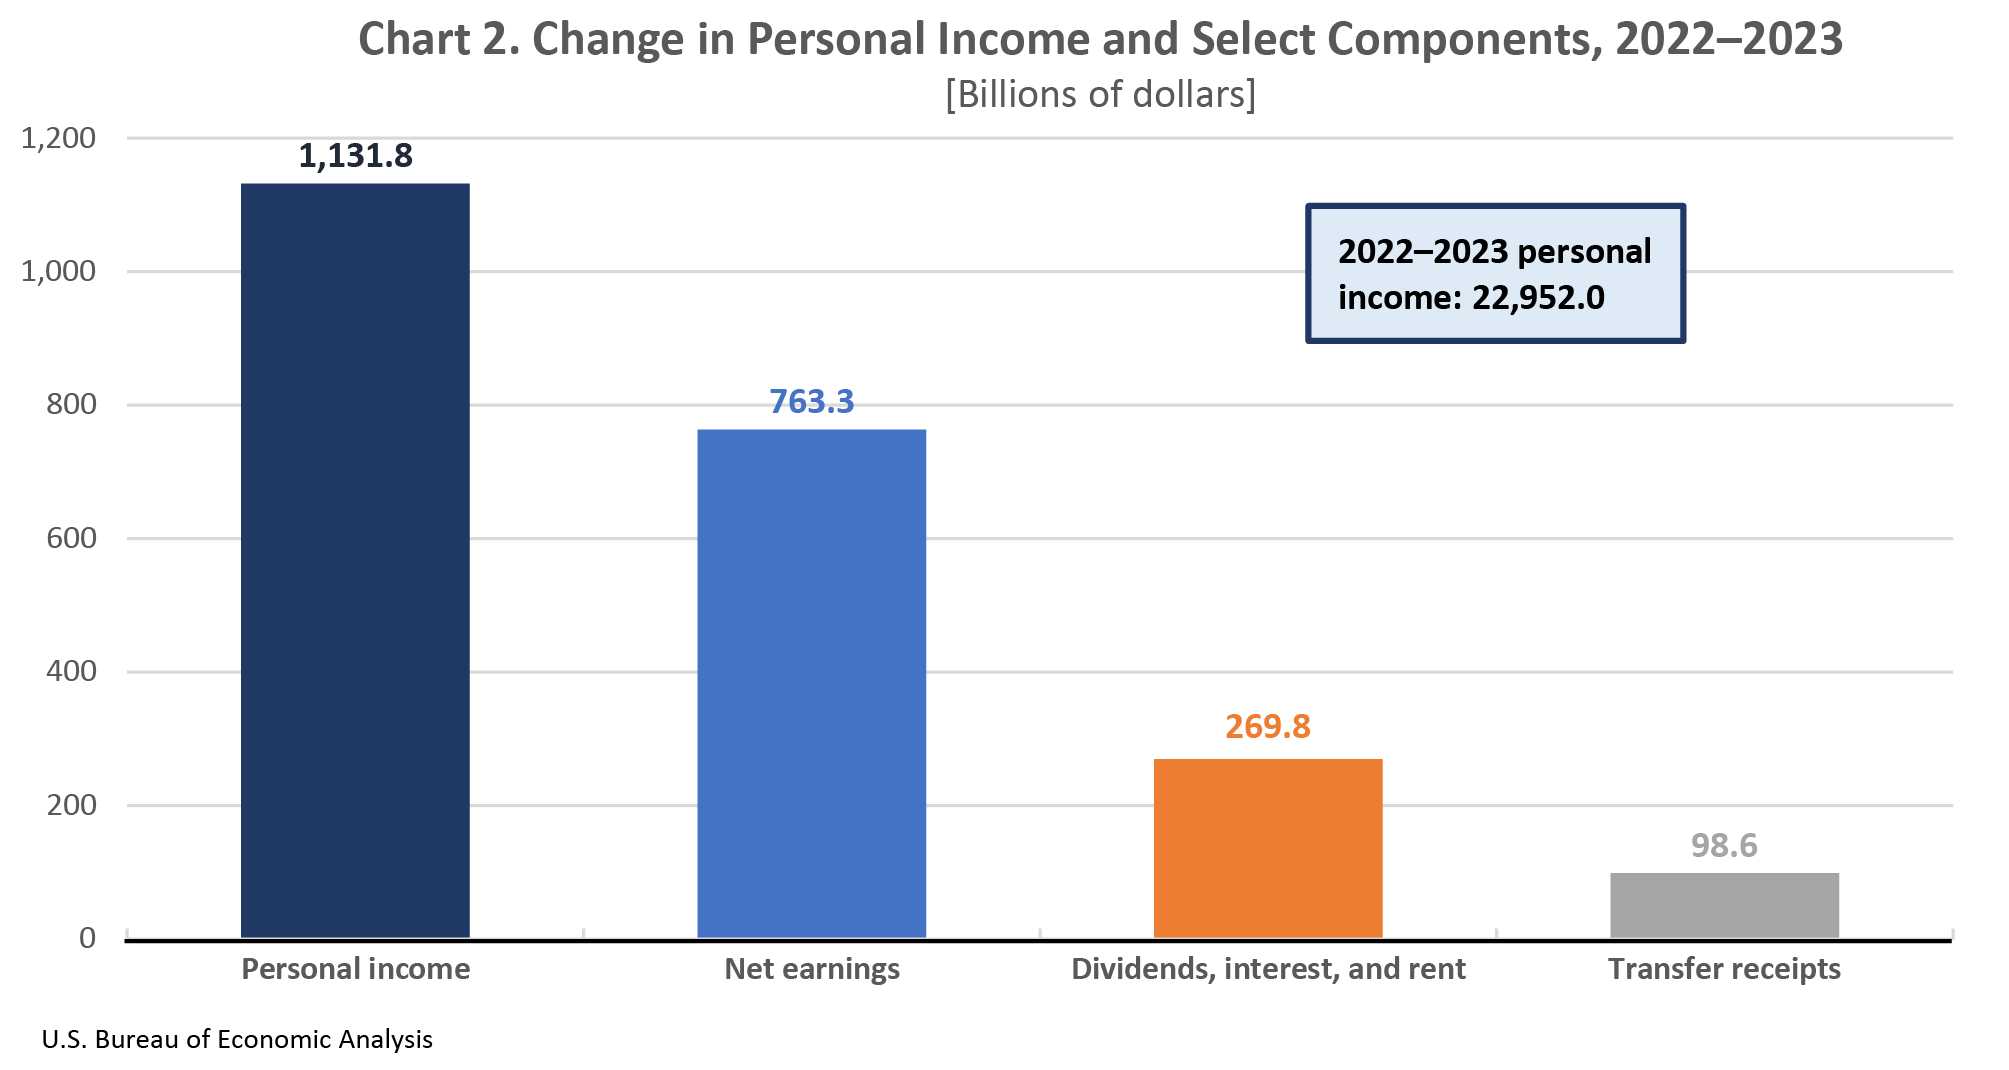
Real gross domestic product (GDP) increased in all 50 states and the District of Columbia in the fourth quarter of 2023, with the percent change ranging from 6.7 percent in Nevada to 0.2 percent in Nebraska (table 1), according to statistics released today by the U.S. Bureau of Economic Analysis (BEA). Current-dollar GDP increased in 49 states and the District of Columbia. For the year 2023, real, or inflation-adjusted, GDP also increased in 49 states and the District of Columbia. Personal income, in current dollars, increased in all 50 states and the District of Columbia in the fourth quarter omf 2023, with the percent change ranging from 6.7 percent in Nevada to 0.8 percent in Iowa and North Dakota (table 4). For the year 2023, current-dollar personal income also increased in all 50 states and the District of Columbia. Quarterly GDP In the fourth quarter of 2023, real GDP for the nation grew at an annual rate of 3.4 percent. Real GDP increased in 18 of the 23 industry groups for which BEA prepares quarterly state estimates (table 2). Nondurable-goods manufacturing, retail trade, and durable-goods manufacturing were the leading contributors to growth in real GDP nationally. Annual GDP In 2023, real GDP for the nation grew at an annual rate of 2.5 percent, with the percent change ranging from 5.9 percent in North Dakota to –1.2 percent in Delaware. Real GDP increased in 17 of the 23 industry groups for which BEA prepares preliminary annual state estimates (table 3). Retail trade; professional, scientific, and technical services; and health care and social assistance were the leading contributors to growth in real GDP nationally. Quarterly personal income In the fourth quarter of 2023, current-dollar personal income increased $229.4 billion, or 4.0 percent at an annual rate (table 4). Increases in earnings and property income (dividends, interest, and rent) were partially offset by a decrease in transfer receipts (chart 1). Earnings increased in 48 states and the District of Columbia, while growing 4.6 percent nationally (table 5). The percent change in earnings ranged from 8.5 percent in Nevada to –0.8 percent in North Dakota. Property income increased in all 50 states and the District of Columbia, while growing 6.7 percent nationally. The percent change ranged from 8.8 percent in Florida to 4.7 percent in Iowa and Mississippi (table 5). Transfer receipts decreased in 32 states and the District of Columbia, while declining 0.7 percent nationally. The percent change in transfer receipts ranged from 8.1 percent in Mississippi to –5.0 percent in Arizona (table 5). Annual personal income In 2023, personal income for the nation increased at an annual rate of 5.2 percent, with the percent change ranging from 7.0 percent in Florida to 3.4 percent in Indiana. Nationally, increases in earnings, property income, and transfer receipts contributed to the increase in personal income (chart 2). Earnings increased in all 50 states and the District of Columbia, while growing 5.6 percent nationally. The percent change in earnings ranged from 8.5 percent in Alaska to 4.0 percent in Mississippi (table 7). Property income increased in all 50 states and the District of Columbia, while growing 6.3 percent nationally. The percent change ranged from 9.0 percent in Idaho to 2.7 percent in Iowa (table 7). Transfer receipts increased in 45 states and the District of Columbia, while growing 2.5 percent nationally. The percent change in transfer receipts ranged from 7.3 percent in the District of Columbia to –8.9 percent in Alaska (table 7). Update of state statistics Today, BEA also released revised quarterly estimates of personal income by state for the first quarter of 2023 through the third quarter of 2023. This update incorporates new and revised source data that are more complete and more detailed than previously available and aligns the states with the national estimates from the National Income and Product Accounts released on March 28, 2024. BEA also released new estimates of per capita personal income for the fourth quarter of 2023, along with revised estimates for the first quarter of 2020 through the third quarter of 2023. BEA used U.S. Census Bureau (Census) population figures to calculate per capita personal income estimates for the first quarter of 2020 through the fourth quarter of 2023. BEA also used new Census population figures to update annual 2020 to 2022 per capita personal income statistics and to produce new per capita personal income statistics for 2023. For earlier estimates, BEA continues to use intercensal population statistics that it developed based on Census methodology. See “Note on Per Capita Personal Income and Population.”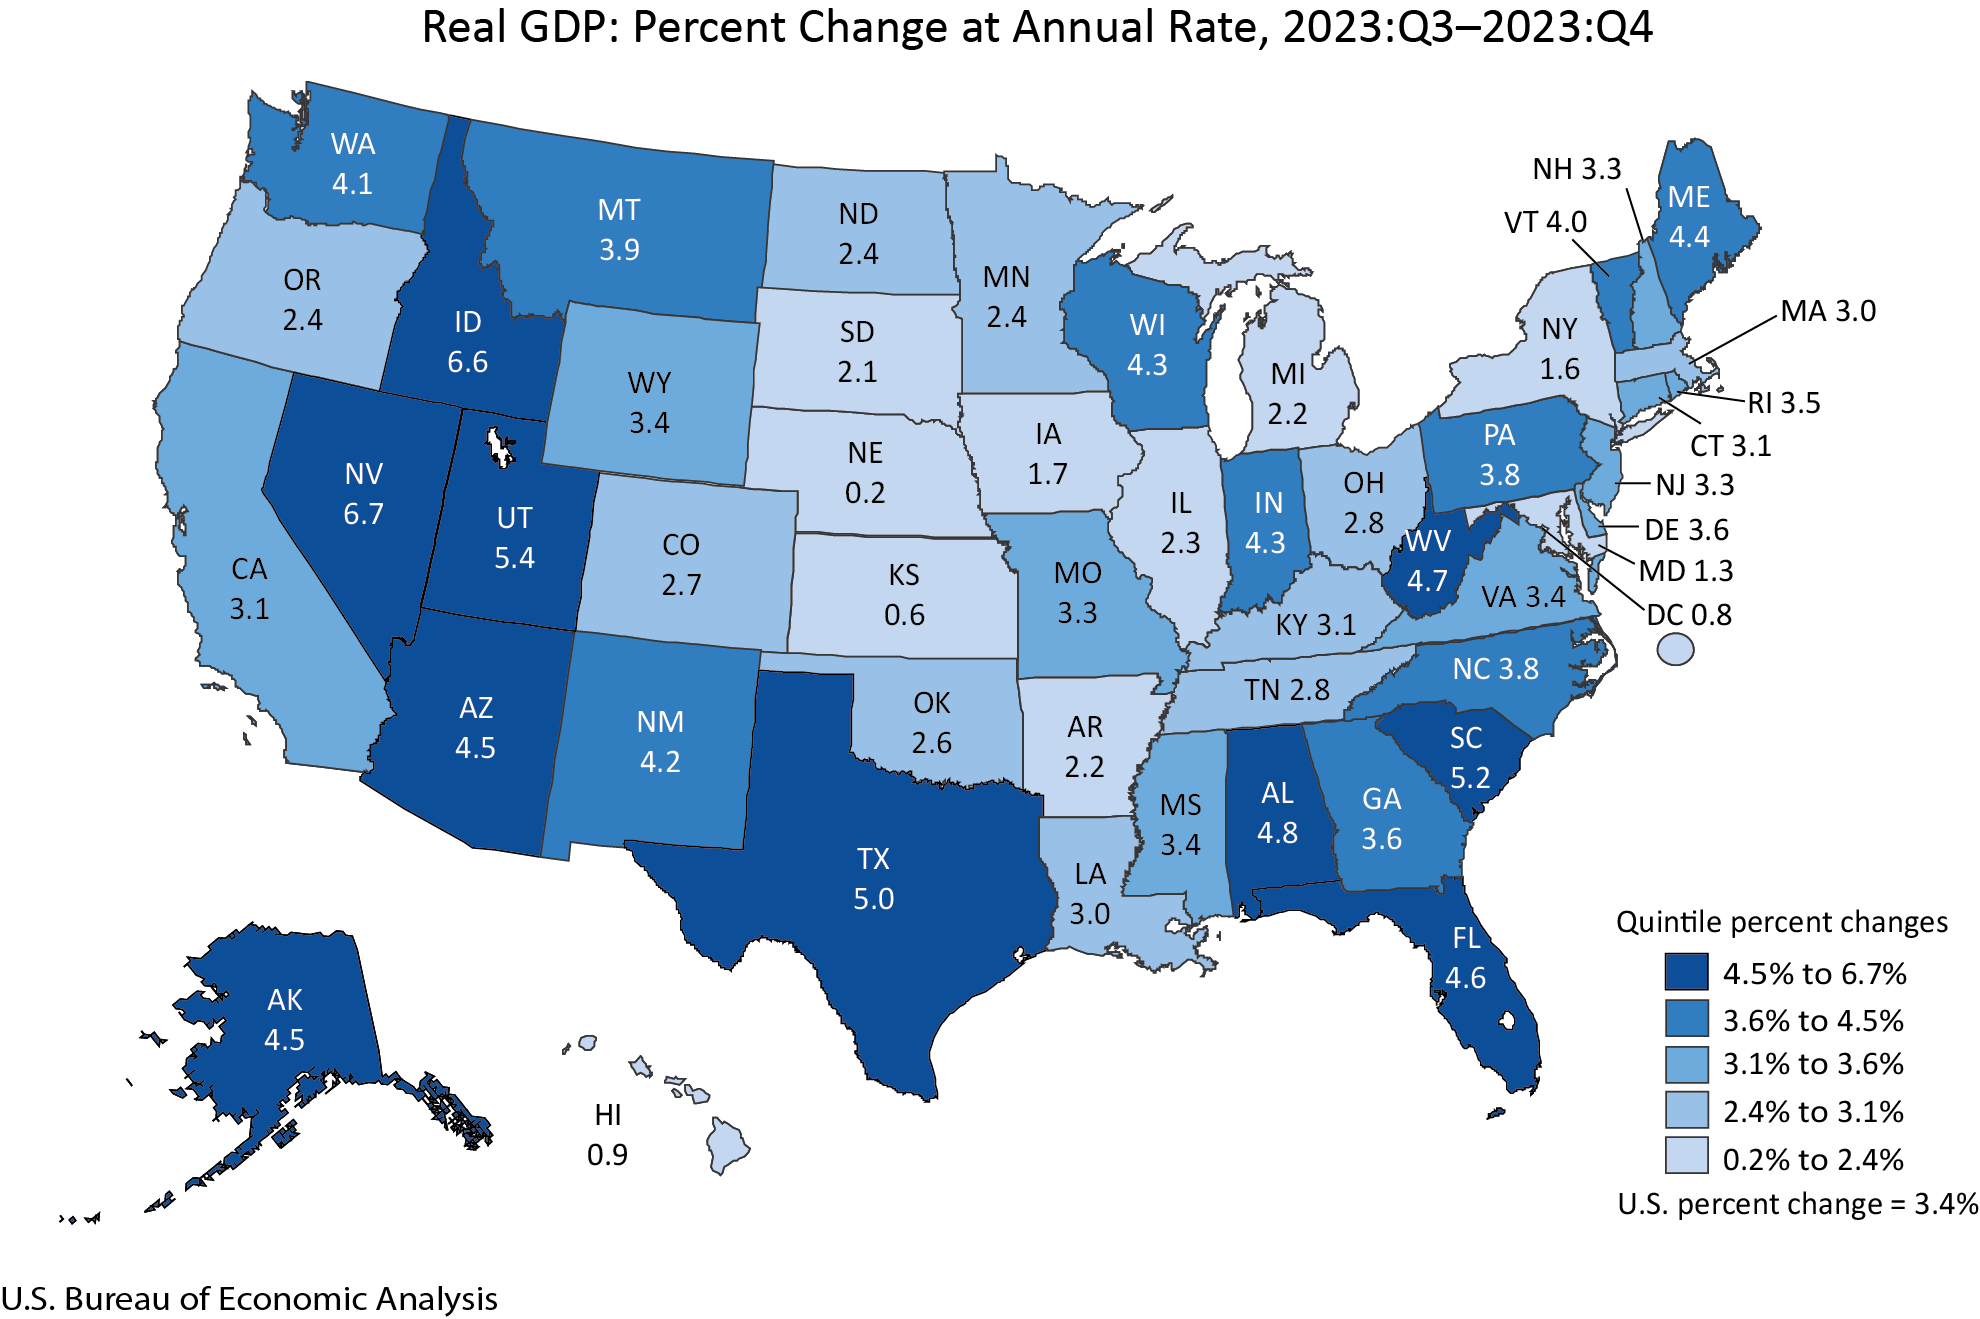
* All content is copyrighted by Industry Intelligence, or the original respective author or source. You may not recirculate, redistrubte or publish the analysis and presentation included in the service without Industry Intelligence's prior written consent. Please review our terms of use.


