April 28, 2023
(press release)
–
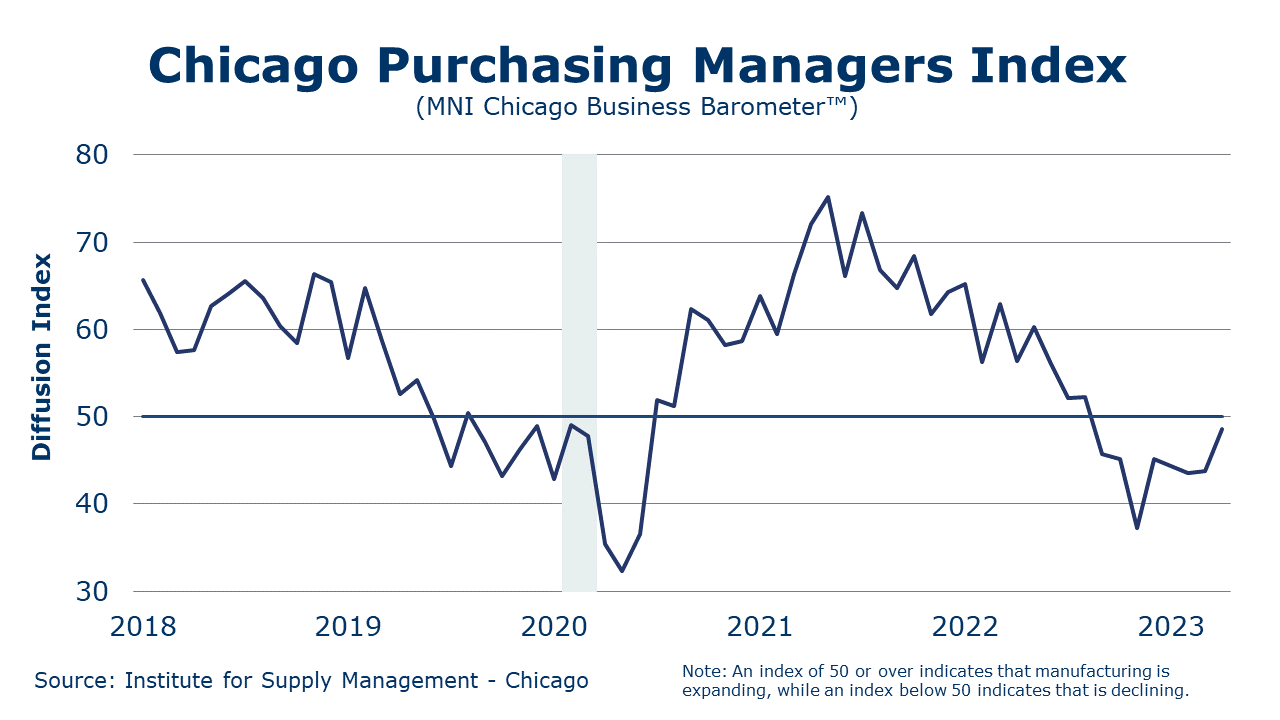
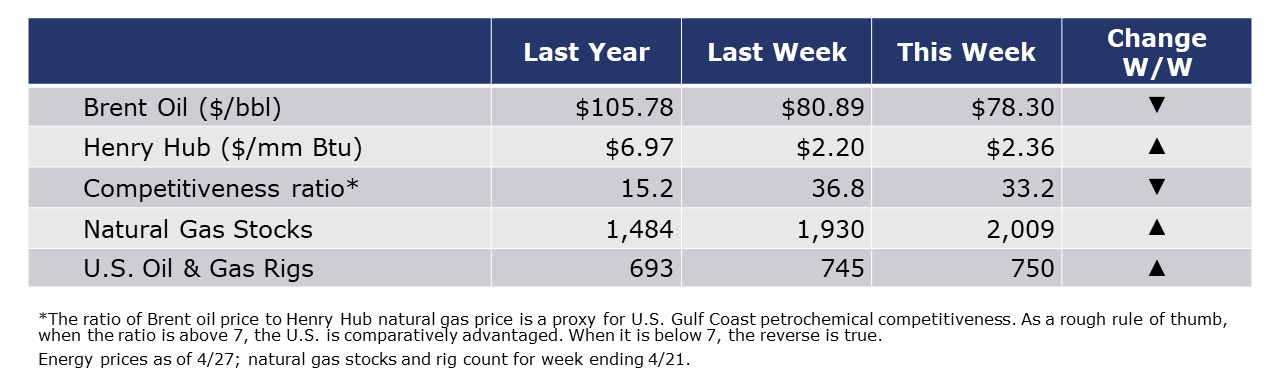
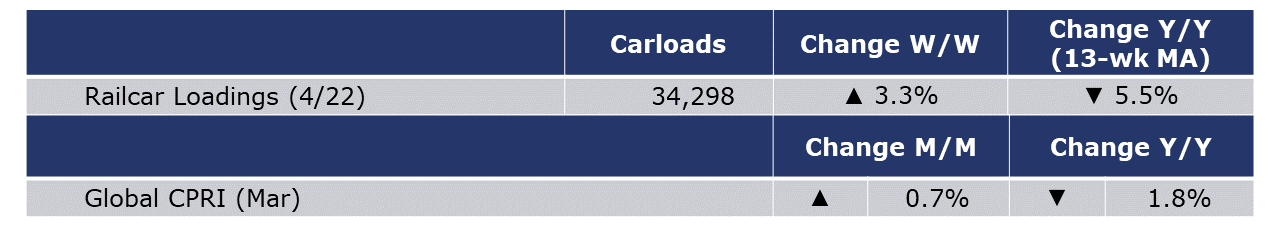
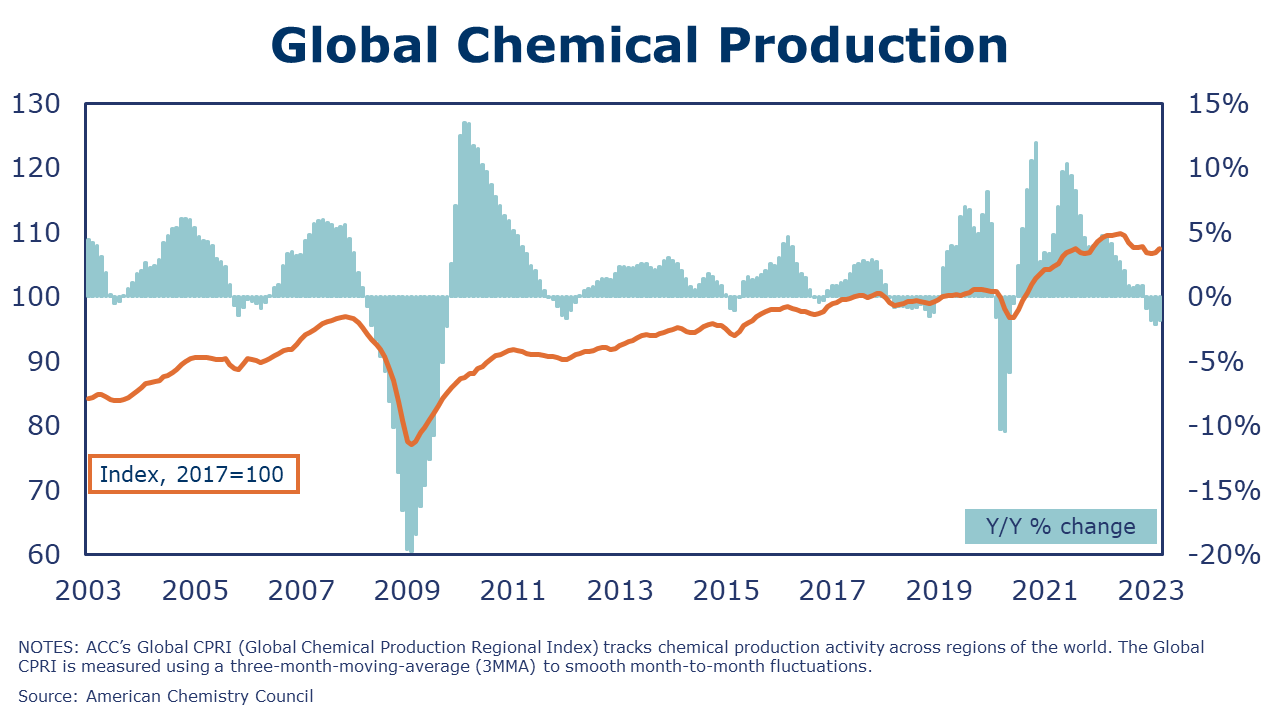
Running tab of macro indicators: 6 out of 20 The number of new jobless claims fell by 16,000 to 230,000 during the week ending April 22. Continuing claims fell by 3,000 to 1.86 million, and the insured unemployment rate for the week ending April 15 was unchanged at 1.3%. Tapped out consumers held tight in March with no change in consumer spending. Rising consumption of services was offset by continued declines in spending on goods. Aggregate personal income (the ability to spend) continued to expand, up 0.3%, reflecting higher employee compensation and rental income. The implied savings rate rose to 5.1%, the highest in more than a year. The price index for personal consumption expenditures (PCE) slowed to a 4.2% Y/Y pace, down from 5.1% in February. Prices for durable goods continued to ease (down four of the past five months) as consumers shift away from those purchases. Excluding food and energy, the core PCE price index rose at a 4.6% annual pace, down slightly from 4.7% in February. It is this core PCE price index that the Fed is targeting with its program of interest rate hikes and unwinding its balance sheet. Following nine consecutive rate increases, core inflation remains persistently strong. The Fed meets again next week to consider its next move. The Conference Board Consumer Confidence Index® fell to 101.3 in April (from 104.0 in March). Consumers’ assessment of present economic and labor market conditions increased while their expectations for the short-term outlook fell sharply. The expectations index remains below 80 and has been there for 13 of the last 14 months. Although consumers’ assessment of the current business environment improved somewhat in April, their expectations fell and remain below the level which often signals a recession looming in the short term. Plans for major purchases such as homes, autos, appliances, and vacations all declined in April, a signal that consumers may be economizing amid growing pessimism. New home sales rose for a fourth straight month in March, up by 9.6%. Sales were down 3.4% Y/Y, however. Higher sales in the Northeast, Midwest, and West offset declines in the South. The inventory of new homes declined from 8.4 months of supply in February to 7.6 in March. The median price for a new home rose 3.2% Y/Y continuing a slowing pace of gains. Real GDP increased at an anemic 1.1% pace in Q1 2023 compared to a 2.6% increase in Q4 2022. The deceleration in real GDP growth in Q1 is due primarily to reduced private inventory investment (particularly wholesale trade and manufacturing) and a slowdown in nonresidential fixed investment. The annual growth of the personal consumption expenditure (PCE) index—a primary inflation index—increased 4.2%, compared to 3.7% in Q4. Excluding food and energy prices, the PCE price index increased 4.9% compared to 4.4% in Q4. Sharply stronger aircraft orders boosted headline durable goods orders, which rose 3.2% in March. Core business goods, however, fell 0.4%, the fourth decline in the past five months, as slowing demand for goods dampens business investment in capital equipment. Compared to a year ago, headline orders were up 5.4% Y/Y while core business orders were ahead 1.9% Y/Y. An early look into manufacturing activity for April, the Chicago Business Barometer® moved higher again to 48.6. Despite the better-than-expected gain, the below-50 reading indicates manufacturing activity contracted for an eighth consecutive month. Manufacturing conditions worsened in Texas during April according to the Dallas Fed’s Texas Manufacturing Outlook Survey. The general business activity composite index fell another 7.7 points to -23.4 with deterioration in new orders, unfilled orders, shipments, and finished goods inventories. Production expanded only slightly compared to March. Looking ahead six months, pessimism grew with the future business activity index down 5.4 points to -16.6. The April manufacturing survey from the Richmond Fed indicated deteriorating business conditions overall, with declining shipments and new orders and increasing employment. Expectations for six months ahead were slightly more negative. Oil prices were lower this week on weaker economic news and deepening concerns about the health of the banking sector. U.S. natural gas prices were higher than last week but remain low at the start of the spring/summer rebuild season. The combined oil and gas rig count rose by five to 750. For the business of chemistry, the indicators brings to mind a red banner for basic and specialty chemicals. According to data released by the Association of American Railroads, chemical railcar loadings were up 1,092 to 34,298 for the week ending 22 April. Loadings were down 5.5% Y/Y (13-week MA), down 6.2% YTD/YTD and have been on the rise for 9 of the last 13 weeks. The Global Chemical Production Regional Index (CPRI) rose 0.7% in March, according to data compiled by ACC. The gain follows a 0.2% gain in February. Like the U.S. CPRI, the global CPRI is measured on a seasonally adjusted 3-month moving average basis. Chemical output was higher in all regions except Africa and the Middle East. The largest gains in February were in North America (+2.4%) and Europe (+0.9%). Output in Asia-Pacific rose 0.4%, including a 0.4% gain in Chinese chemical production. Within segments, the largest gains were in synthetic materials (0.9%) and specialty chemicals (+0.8%). Additional details on the Global CPRI will be available to members on ACCExchange in the next week or send an email to David_lan@americanchemistry.com to be added to a distribution list for the Global CPRI report. The banner colors represent observations about the current conditions in the overall economy and the business chemistry. For the overall economy we keep a running tab of 20 indicators. The banner color for the macroeconomic section is determined as follows: Green – 13 or more positives For the chemical industry there are fewer indicators available. As a result, we rely upon judgment whether production in the industry (defined as chemicals excluding pharmaceuticals) has increased or decreased three consecutive months. ACC members can access additional data, economic analyses, presentations, outlooks, and weekly economic updates through ACCexchange. In addition to this weekly report, ACC offers numerous other economic data that cover worldwide production, trade, shipments, inventories, price indices, energy, employment, investment, R&D, EH&S, financial performance measures, macroeconomic data, plus much more. To order, visit http://store.americanchemistry.com/. Every effort has been made in the preparation of this weekly report to provide the best available information and analysis. However, neither the American Chemistry Council, nor any of its employees, agents or other assigns makes any warranty, expressed or implied, or assumes any liability or responsibility for any use, or the results of such use, of any information or data disclosed in this material. Contact us at ACC_EconomicsDepartment@americanchemistry.com.MACROECONOMY & END-USE MARKETS


ENERGY
CHEMICALS
Note On the Color Codes
Yellow – between 8 and 12 positives
Red – 7 or fewer positivesFor More Information

* All content is copyrighted by Industry Intelligence, or the original respective author or source. You may not recirculate, redistrubte or publish the analysis and presentation included in the service without Industry Intelligence's prior written consent. Please review our terms of use.


