November 3, 2022
(press release)
–
The Department of Transportation’s Bureau of Transportation Statistics (BTS) today released U.S. airlines’ September fuel cost and consumption numbers indicating U.S. scheduled service airlines used 1.4 billion gallons of fuel, 6.7% less fuel than in August 2022 (1.50 billion gallons) and 5.4% less than in pre-pandemic September 2019. The cost per gallon of fuel in September 2022 ($3.49) was up 2 cents (0.6%) from August 2022 ($3.47) and up $1.53 (78.1%) from September 2019. Total September 2022 fuel expenditure ($4.89B) was down 6.3% from August 2022 ($5.22B) and up 69.2% from pre-pandemic September 2019. Year-over-year increases in fuel consumption and cost for September include 7.0% in domestic fuel consumption, 86.3% in domestic fuel cost, and 74.2% in cost per gallon. Domestic fuel consumption decreased 6.1% from August to September in 2022, while also decreasing 1.7% from September 2019. Fuel consumed by U.S. airlines (total) scheduled service: September 2019: 1.48 billion gallons Fuel cost per gallon for U.S. airlines (total) scheduled service: September 2019: $1.96 Total fuel cost for U.S. airlines (total) scheduled service: September 2019: $2.89 billion Fuel Cost and Consumption data from January 2000 to the present can be found at https://transtats.bts.gov/fuel.asp. Summaries by month are also available. Airline fuel costs may be affected by hedging, contracts that allow airlines to limit exposure to future price changes. Individual airline numbers through June 2022 are available on the BTS website. Please Note: The information provided within BTS statistical releases may not be based on 100% of reporting carriers. Generally, data are released per schedule if reports have been received from at least 90% of the carriers, along with data from all the major carriers. Regarding this release, the following carriers remain pending: Elite Airways (WL) and Caribbean Sun Airlines (2HQ). Percent change results may not be exact due to rounding. 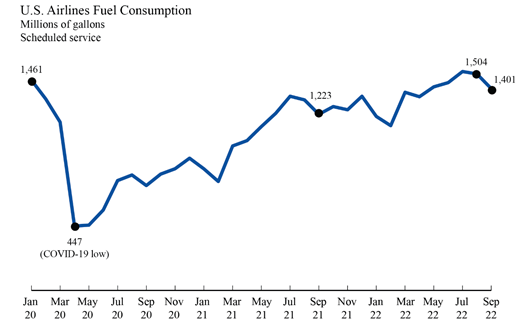
September 2021: 1.22 billion gallons
August 2022: 1.50 billion gallons
September 2022: 1.40 billion gallons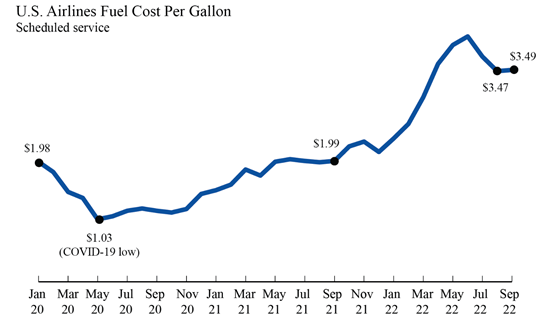
September 2021: $1.99
August 2022: $3.47
September 2022: $3.49
September 2021: $2.43 billion
August 2022: $5.22 billion
September 2022: $4.89 billion
* All content is copyrighted by Industry Intelligence, or the original respective author or source. You may not recirculate, redistrubte or publish the analysis and presentation included in the service without Industry Intelligence's prior written consent. Please review our terms of use.


