March 21, 2023
(press release)
–
Washington — American Trucking Associations’ advanced seasonally adjusted (SA) For-Hire Truck Tonnage Index rose 1.2% in February after increasing 0.6% in January. In February, the index equaled 118.4 (2015=100) compared with 117 in January. “Tonnage has increased sequentially for the last three months totaling 2.9 percent,” said ATA Chief Economist Bob Costello. “As a result, the index is just 0.3 percent below the recent high in September. The fact that our index is growing sequentially and on a year-over-year basis demonstrates that contract freight continues to hold up at high levels. “Looking ahead, we continue to see evidence the inventory cycle is improving, which means bloated stocks will stop being a headwind and eventually help truck freight volumes,” Costello said. “Increased infrastructure spending will also boost volumes heading into the summer months. However, we expect to see continued freight softness related to lower home construction and slowing factory output.” Compared with February 2022, the SA index increased 2.3%, which was the eighteenth straight year-over-year gain, but the largest since October. In January, the index was up 1.4% from a year earlier. In 2022, compared with the average in 2021, tonnage was up 3.5%. The not seasonally adjusted index, which represents the change in tonnage actually hauled by the fleets before any seasonal adjustment, equaled 107.6 in February, 4.5% below the January level (112.6). In calculating the index, 100 represents 2015. ATA’s For-Hire Truck Tonnage Index is dominated by contract freight as opposed to spot market freight. Trucking serves as a barometer of the U.S. economy, representing 72.2% of tonnage carried by all modes of domestic freight transportation, including manufactured and retail goods. Trucks hauled 10.93 billion tons of freight in 2021. Motor carriers collected $875.5 billion, or 80.8% of total revenue earned by all transport modes. ATA calculates the tonnage index based on surveys from its membership and has been doing so since the 1970s. This is a preliminary figure and subject to change in the final report issued around the 5th day of each month. The report includes month-to-month and year-over-year results, relevant economic comparisons and key financial indicators.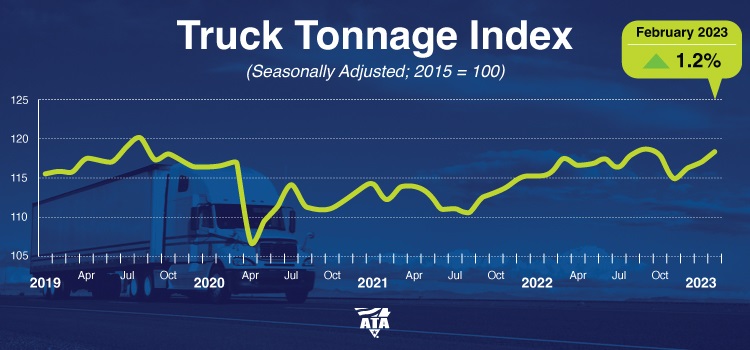
* All content is copyrighted by Industry Intelligence, or the original respective author or source. You may not recirculate, redistrubte or publish the analysis and presentation included in the service without Industry Intelligence's prior written consent. Please review our terms of use.


