OTTAWA
,
August 15, 2022
(press release)
–
Wholesale sales rise slightly in June Constant dollar sales fell 0.1% in June. Chart 1: Wholesale sales increase in June Sales of agricultural supplies and motor vehicles drive increase in June Sales of motor vehicles and motor vehicle parts and accessories rose 3.1% to $12.2 billion in June due to higher sales in the motor vehicle industry (+5.3% to $9.6 billion). Sales of motor vehicles continue to fluctuate monthly as manufacturers are challenged with maintaining production due to ongoing supply chain issues, particularly with respect to semiconductors. However, there appears to be some stabilization in the subsector as sales of motor vehicles and motor vehicle parts and accessories rose during three of the past four months. In June 2022, sales were 12.0% higher than the same month the previous year. The personal and household goods subsector posted the largest drop in June with sales falling 3.5% to $11.1 billion. Sales in four of the five component industries fell, with substantial decreases in the textile, clothing and footwear (-12.0% to $1.5 billion) and the pharmaceuticals and pharmacy supplies (-2.5% to $5.6 billion) industries. Excluding the personal household goods subsector, wholesale sales would have risen 0.7% in June. Overall, sales in the second quarter of 2022 rose 0.6% to $241.2 billion, an 11.6% increase from the same quarter in 2021. This was the third consecutive quarterly increase. There was growth in five of the seven subsectors, representing 69% of sales for the second quarter of 2022. The largest increases came from the food, beverage and tobacco and miscellaneous goods subsectors, their sixth and eighth consecutive quarterly increases, respectively. In contrast, quarterly sales of building material and supplies and personal and household goods fell. This was the first quarterly decline in personal and household goods since the second quarter of 2020. Saskatchewan and Manitoba lead provincial sales Saskatchewan reported the highest provincial increase in sales in June, up 14.9% to $4.2 billion. Sales rose in five of the seven subsectors. The driving factor for sales in this province was the agricultural supply industry of the miscellaneous subsector, which increased 30.3% on the strength of record exports of fertilizer products. While other subsectors in the province encountered some movement, their changes were negligible compared with the shift in the miscellaneous subsector. Sales in Manitoba rose 20.7% to $2.1 billion, with all subsectors reporting higher sales. Like Saskatchewan, the growth was primarily driven by higher sales of agricultural supplies in the miscellaneous subsector. Additional contributions to the province growth included a 10.2% increase from the machinery, equipment and supplies subsector, and a 7.0% increase in sales from the food, beverage and tobacco merchant wholesalers. Quebec led the declines among the seven remaining provinces with a decrease of 2.8% to $14.4 billion. Six of seven subsectors reported lower sales, led by a 5.5% decline in the personal and household goods subsector and a 4.6% decline in the food, beverage and tobacco subsector. The machinery, equipment and supplies subsector reported the only increase in June, up 1.0%, which did little to offset the provincial decline. Five provinces and all territories had higher sales in the second quarter of 2022 when compared with the previous quarter. Leading the gains were Alberta, up 4.3%, and Saskatchewan, up 10.0%. Together with Ontario, these provinces were responsible for 91% of the quarterly increase in sales. Inventory levels continue to grow The building material and supplies subsector reported the highest growth in inventories in June, up 6.1% to $23.5 billion. This marks the third consecutive month of growth for the subsector. While all three component industries had higher inventories, gains in the lumber, millwork, hardware and other building supplies industry far surpassed those of the electrical, plumbing, heating and air-conditioning equipment and supplies industry and the metal service centres industry. The growing stocks of lumber, millwork, hardware and other building supplies coincide with the decline in demand domestically and abroad, as exports of lumber and other sawmill products fell 13.1% in June. Growth in the miscellaneous subsector also contributed to the overall increase in June, up 6.9% to $18.3 billion. The growth was primarily driven by the agricultural supplies industry. While lower inventories were reported in the recyclable material industry and paper, paper product and disposable plastic product industry, these changes did little to offset the growth in the subsector. The motor vehicle and motor vehicle parts and accessories subsector was the only subsector in June to have reported a decrease. Inventories declined 3.2% to $12.5 billion, largely due to falling supplies of new motor vehicle parts and accessories. Wholesale inventories increased by 9.1% in the second quarter of 2022. This increase was led by growth in stocks of machinery, equipment and supplies merchant wholesalers (+8.8%), miscellaneous merchant wholesalers (+16.7%) and building material and supplies (+11.4%). This is the first quarter to have growth in all subsectors since the second quarter of 2019. The inventory-to-sales ratio increased from 1.44 in May to 1.49 in June. This ratio is a measure of the time (in months) required to exhaust inventories if sales were to remain at their levels. Note to readers Seasonally adjusted data are data that have been modified to eliminate the effect of seasonal and calendar influences to allow for more meaningful comparisons of economic conditions from period to period. For more information on seasonal adjustment, see Section 2: Issues related to analysis and interpretation. Trend-cycle estimates are included in selected charts as a complement to the seasonally adjusted series. These data represent a smoothed version of the Seasonally adjusted time series (see Section 1: Concepts and definitions) and provide information on longer-term movements, including changes in direction underlying the series. For information on trend-cycle data, see Trend-cycle estimates – Frequently asked questions. Both seasonally adjusted data and trend-cycle estimates are subject to revision as additional observations become available. These revisions could be large and could even lead to a reversal of movement, especially for reference months near the end of the series or during periods of economic disruptions. Total wholesale sales expressed in volume are calculated by deflating current dollar values using relevant price indexes. The wholesale sales series in chained (2012) dollars is a chained Fisher volume index, with 2012 as the reference year. For more information, see "Deflation of wholesale sales." The Monthly Wholesale Trade Survey covers all industries within the wholesale trade sector, as defined by the North American Industry Classification System (NAICS), with the exception of oilseed and grain merchant wholesalers (NAICS 41112), petroleum and petroleum products merchant wholesalers (NAICS 412) and business-to-business electronic markets, and agents and brokers (NAICS 419). Real-time data tables Next release Products Contact information Industry Intelligence Editor's Note: This press release omits select charts and/or marketing language for editorial clarity. Click here to view the full report.
In June, wholesale sales rose 0.1% to $80.7 billion, the ninth increase in the past 12 months. Growth was recorded as a result of increases in two of seven subsectors—miscellaneous and motor vehicle and motor vehicle parts and accessories subsectors—which account for 30% of wholesale sales.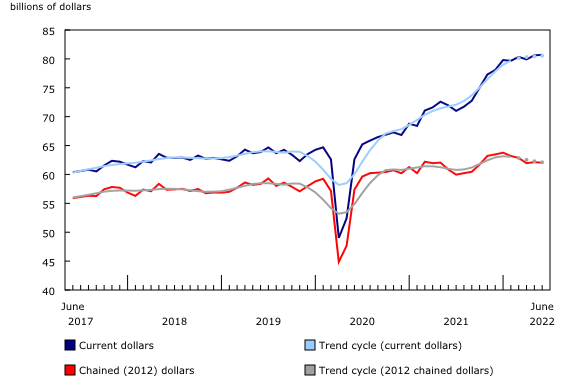
Sales of miscellaneous goods increased for the fourth time in five months. A 3.5% increase in sales marked the first time this subsector surpassed $12 billion. Growth of 15.5% in the agricultural supplies industry and 3.3% in the chemical and allied product (except agricultural) industry generated the bulk of the gain as three of the five industries recorded higher sales in June. The growth reflects the demand for Canadian fertilizer because of the ongoing conflict in Ukraine. Canadian exports of fertilizers, pesticides, and other chemical products have risen 30.6% since January, with 3.2% of that increase coming in June.
Sales increased in three provinces and one territory in June, representing 19% of national sales. The increase was predominantly due to higher sales in Saskatchewan and Manitoba, while Quebec recorded the largest drop in sales.
Inventories increased 3.4% to $120.0 billion in June. Six of seven subsectors reported increased inventories, headed by gains in the building material and supplies and miscellaneous subsectors. Motor vehicle and motor vehicle parts and accessories was the only subsector with reduced inventories in June.
All data in this release are seasonally adjusted and expressed in current dollars, unless otherwise noted.
Real-time data tables 20-10-0019-01, 20-10-0020-01 and 20-10-0005-01 will be updated soon.
Wholesale trade data for July 2022 will be released on September 16, 2022.
The product "Monthly Wholesale Trade Survey: Interactive Tool" (Catalogue number71-607-X) is available online. This product is based on the data published in the tables of the Monthly Wholesale Trade Survey: 20-10-0074-01, 20-10-0076-01 and 20-10-0003-01.
For more information, or to enquire about the concepts, methods or data quality of this release, contact us (toll-free 1-800-263-1136; 514-283-8300; infostats@statcan.gc.ca) or Media Relations (statcan.mediahotline-ligneinfomedias.statcan@statcan.gc.ca).
* All content is copyrighted by Industry Intelligence, or the original respective author or source. You may not recirculate, redistrubte or publish the analysis and presentation included in the service without Industry Intelligence's prior written consent. Please review our terms of use.


