OTTAWA
,
October 16, 2023
(press release)
–
Wholesale sales (excluding petroleum, petroleum products, and other hydrocarbons and excluding oilseed and grain) increased 2.3% to $83.0 billion in August. Sales increased in five of the seven subsectors, led by the machinery, equipment and supplies subsector and the miscellaneous subsector. On an annual basis, wholesale sales (excluding petroleum, petroleum products, and other hydrocarbons and excluding oilseed and grain) were higher (+1.1%). Petroleum products as well as oilseed and grain data continue to be available in data tables but will be excluded from monthly analysis until historical data are available for monthly and annual analysis. Based on respondent feedback, the strike at the ports in British Columbia affected the business activities of approximately 1.4% of Canadian wholesalers in August, which is lower than the reported impact in July (3.7%). In August, a supply shortage or material delays and transportation disruptions impacted the wholesale businesses the most. On an unadjusted basis, the largest estimated impacts on sales in dollar terms were in the machinery, equipment and supplies subsector. In volume terms, wholesale sales (excluding petroleum, petroleum products, and other hydrocarbons and excluding oilseed and grain) grew 2.2% in August. Chart 1: Wholesale sales (excluding petroleum, petroleum products, and other hydrocarbons and excluding oilseed and grain) increase in August Higher sales in the machinery, equipment and supplies subsector lead wholesale sales growth in August The miscellaneous subsector (+6.9% to $10.3 billion) also contributed to the sector growth in August. A majority of the industry groups reported a decline in sales. However, the agricultural supplies industry group (+22.0% to $3.5 billion) and the recyclable material industry group (+21.3% to $1.3 billion) recorded significant growth that offset the declines and led the subsector to report an increase. Higher sales in the agricultural supplies industry group were due to shipments of completed orders and higher prices of related products , such as agricultural chemical products. The third subsector to report a gain in August was the building material and supplies subsector, up 1.0% to $12.0 billion. Of the subsector's three industry groups, two reported a monthly increase, led by the electrical, plumbing, heating and air-conditioning equipment and supplies industry group (+2.9% to $3.9 billion). Sales in Ontario lead provincial gains Wholesale sales (excluding petroleum, petroleum products, and other hydrocarbons and excluding oilseed and grain) in Ontario increased by 2.1% to $43.6 billion in August. Growth in Ontario was reported in six of the seven subsectors, with the largest growth coming from the machinery, equipment and supplies subsector (+6.4% to $9.3 billion), followed by the miscellaneous subsector (+6.2% to $4.9 billion). The second-largest provincial growth was in Saskatchewan, up 12.4% to $3.4 billion in August. Higher sales were recorded in the miscellaneous subsector (+15.1% to $1.4 billion) and the machinery, equipment and supplies subsector (+19.8% to $1.1 billion). Sales in British Columbia rose 4.6% to $7.9 billion. Growth was reported in all of the subsectors, with the largest increase coming from the miscellaneous subsector (+15.5% to $937.1 million), followed by the food, beverage and tobacco subsector (+4.5% to $1.6 billion) and the building material and supplies subsector (+3.4% to $2.1 billion). Inventories continue to grow in August Increased inventories were reported in four of the seven subsectors, led by the building material and supplies subsector (+2.8% to $23.7 billion), followed by the machinery, equipment and supplies subsector (+1.1% to $38.2 billion). The inventory-to-sales ratio fell from 1.58 in July to 1.55 in August. This ratio is a measure of the time (in months) required to exhaust inventories if sales were to remain at their current levels. Note to readers Seasonally adjusted data are data that have been modified to eliminate the effect of seasonal and calendar influences to allow for more meaningful comparisons of economic conditions from period to period. For more information on seasonal adjustment, see Section 2: Issues related to analysis and interpretation. Trend-cycle estimates are included in selected charts as a complement to the seasonally adjusted series. These data represent a smoothed version of the seasonally adjusted time series (see Section 1: Concepts and definitions) and provide information on longer-term movements, including underlying changes in direction in the series. For information on trend-cycle data, see Trend-cycle estimates – Frequently asked questions. Both seasonally adjusted data and trend-cycle estimates are subject to revision as additional observations become available. These revisions could be large and could even lead to a reversal of movement, especially for reference months near the end of the series or during periods of economic disruptions. Total wholesale sales expressed in volume are calculated by deflating current dollar values using relevant price indexes. The wholesale sales series in chained (2012) dollars is a chained Fisher volume index, with 2012 as the reference year. For more information, see the publication ''Deflation of wholesale sales.'' The Monthly Wholesale Trade Survey covers all industries within the wholesale trade sector, as defined by the North American Industry Classification System (NAICS), with the exception of business-to-business electronic markets, and agents and brokers (NAICS 419). Real-time data tables Next release Products Contact information Industry Intelligence Editor's Note: This press release omits select charts and/or marketing language for editorial clarity. Click here to view the full report.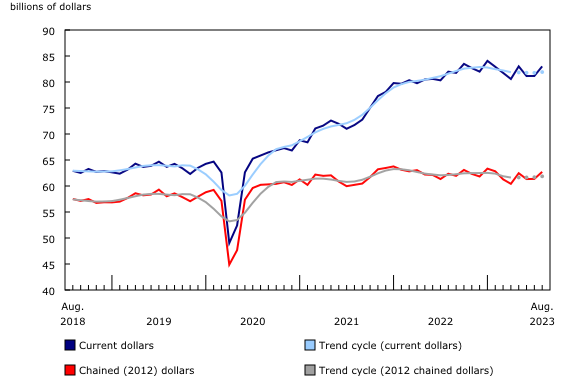
Sales in the machinery, equipment and supplies subsector grew by 5.2% to $18.6 billion in August, recording their first increase in three months. The increase was widespread across all four industry groups in August, led by higher sales in the farm, lawn and garden machinery and equipment industry group (+17.6% to $2.6 billion). The increase in the subsector sales aligns with the higher imports of industrial machinery and equipment (+7.5%) reported in August.
A majority of the provinces reported growth in wholesale sales (excluding petroleum, petroleum products, and other hydrocarbons and excluding oilseed and grain), led by Ontario and followed by Saskatchewan and British Columbia.
Wholesale inventories (excluding petroleum, petroleum products, and other hydrocarbons and excluding oilseed and grain) rose 0.5% to $128.5 billion in August.
All data in this release are seasonally adjusted and expressed in current dollars unless otherwise noted.
Real-time data tables 20-10-0019-01, 20-10-0020-01 and 20-10-0005-01 will be updated soon.
Wholesale trade data for September will be released on November 15.
The product "Monthly Wholesale Trade Survey: Interactive Tool" (Catalogue number71-607-X) is available online. This product is based on the data published in the tables of the Monthly Wholesale Trade Survey: 20-10-0074-01, 20-10-0076-01 and 20-10-0003-01.
For more information, or to enquire about the concepts, methods or data quality of this release, contact us (toll-free 1-800-263-1136; 514-283-8300; infostats@statcan.gc.ca) or Media Relations (statcan.mediahotline-ligneinfomedias.statcan@statcan.gc.ca).
* All content is copyrighted by Industry Intelligence, or the original respective author or source. You may not recirculate, redistrubte or publish the analysis and presentation included in the service without Industry Intelligence's prior written consent. Please review our terms of use.


