OTTAWA
,
May 10, 2023
(press release)
–
The total monthly value of building permits in Canada advanced 11.3% in March to $11.8 billion, led by sharply increasing monthly non-residential growth (+32.0%). On a constant dollar basis (2012=100), the total value of building permits went up 12.2% to $6.9 billion. Chart 1: Total value of building permits, seasonally adjusted Infographic 1: Building permits, March 2023 Non-residential permits ramp up as sector reaches record high The largest project of the month was the $570 million new General Motors and POSCO Chemical cathode active materials facility in Bécancour, Quebec, which led the value of building permits in the industrial component to sharply increase by 16.7% nationally. This project is linked to the Canadian Critical Minerals Strategy, for which further major investments in industrial projects are anticipated. Commercial (+41.5%) and institutional (+29.5%) construction intentions also posted significant monthly gains to support a record-high month for the non-residential sector. Chart 2: Value of building permits for the residential and non-residential sectors Residential construction intentions stall British Columbia continued to sharply increase with strong construction intentions (values up +30.9% or + $321.9 million) in March, concentrated in metropolitan high-rise multi-dwelling developments. The four Atlantic provinces collectively also had notable monthly gains in multi-dwelling (+40.6% or +$48.1 million) and total residential (+14.0% or +$39.5 million) permit values. These gains were nationally offset by declines in five provinces. Ontario (-8.1% or -$246.6 million) weighed down the sector the most, while Saskatchewan (-27.0% or -$12.7 million) posted the largest proportional decline of the month. Chart 3: Value of building permits for the single-family and multi-family components First quarter of 2023 ticks upward, led by non-residential building permits On a constant dollar basis (2012=100), the total quarterly value of building permits increased 3.4% to $18.9 billion. The commercial component (+17.2%) led the quarterly growth, much of which was from building permits issued in March. Overall, the non-residential sector expanded 16.1% to a record-high $13.0 billion in the first quarter of 2023, greatly exceeding the previous quarterly record of $12.4 billion. This coincided with the Bank of Canada's decision to pause interest rate hikes, the first reprieve since initial hikes started in March 2022. However, this signalling is yet to be reflected in residential construction intentions, which declined 1.6% to $19.4 billion, sliding for the third consecutive quarter. Declines in the value of residential permits were posted in six provinces which more than offset gains in Ontario, Manitoba, Nova Scotia and Prince Edward Island. Manitoba posted the most notable quarterly gains in both the value of residential permits (+27.5%) and the number of new dwelling units created (+58.7%), as their quarterly population growth simultaneously edged out the national average. To explore data using an interactive user interface, visit the Building permits: Interactive Dashboard. For more information on construction, please visit the Construction statistics portal. For more information on housing, please visit the Housing statistics portal. Statistics Canada has a Housing Market Indicators dashboard. This web application provides access to key housing market indicators for Canada, by province and by census metropolitan area. The indicators are updated automatically with new information from monthly releases, giving users access to the latest data. Note to readers Building components Revision For information on trend-cycle data, see the StatCan Blog and Trend-cycle estimates – Frequently asked questions. Next release Contact information Industry Intelligence Editor's Note: This press release omits select charts and/or marketing language for editorial clarity. Click here to view the full report.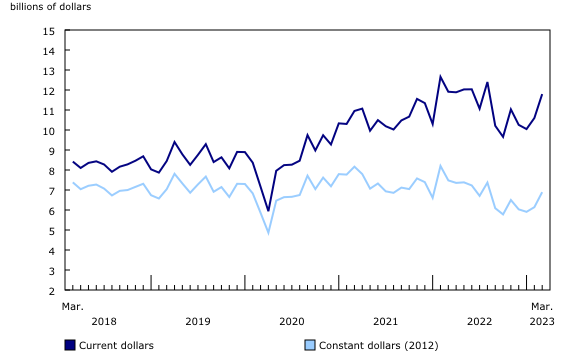

The total monthly value of non-residential permits sharply increased 32.0% to a record-high $5.2 billion, with 10 individual non-residential projects valued at over $100 million each.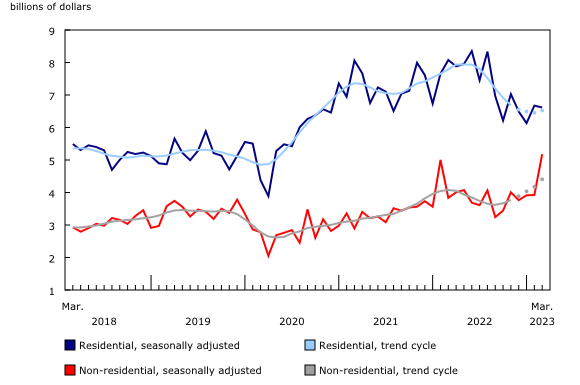
Following a promising February, March saw the value of new residential permits taper off (-0.9%) to $6.6 billion. Nationally, permits for 21,400 new dwellings were issued in the month.
The total value of building permits in the first quarter of 2023 gained 4.8% from the last quarter of 2022 to $32.4 billion, ending three consecutive quarterly declines.
Unless otherwise stated, this release presents seasonally adjusted data with current dollar values, which facilitate month-to-month and quarter-to-quarter comparisons by removing the effects of seasonal variations. For information on seasonal adjustment, see Seasonally adjusted data – Frequently asked questions.
Data are subject to revisions based on late responses, methodological changes and classification updates. Unadjusted data has been revised for the previous month. Seasonally adjusted data has been revised for the previous three months.
Data on building permits for March will be released on June 6.
For more information, or to enquire about the concepts, methods or data quality of this release, contact us (toll-free 1-800-263-1136; 514-283-8300; infostats@statcan.gc.ca) or Media Relations (statcan.mediahotline-ligneinfomedias.statcan@statcan.gc.ca).
* All content is copyrighted by Industry Intelligence, or the original respective author or source. You may not recirculate, redistrubte or publish the analysis and presentation included in the service without Industry Intelligence's prior written consent. Please review our terms of use.


