IRVINE, California
,
March 16, 2022
(press release)
–
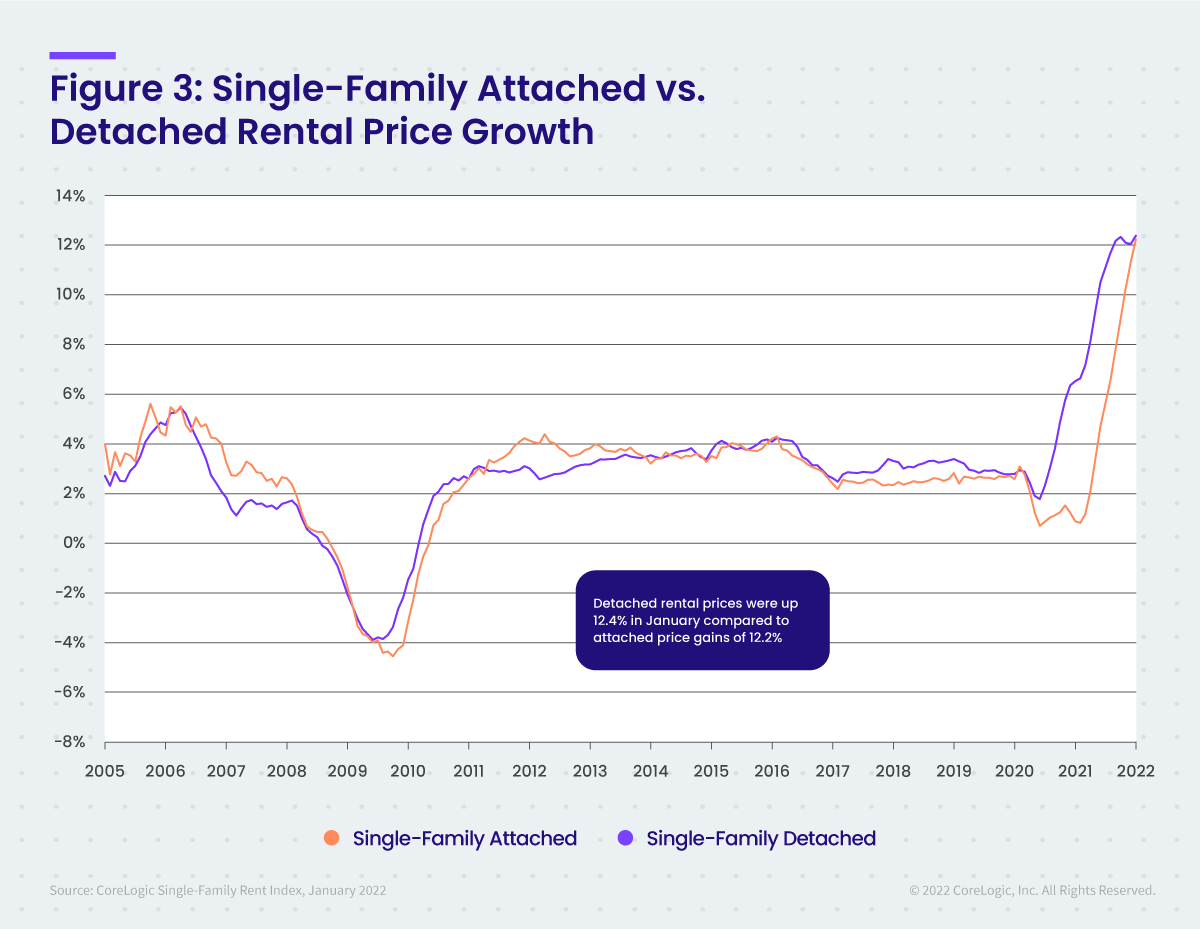
CoreLogic, a leading global property information, analytics and data-enabled solutions provider, today released its latest Single-Family Rent Index (SFRI), which analyzes single-family rent price changes nationally and across major metropolitan areas. U.S. single-family rent prices started 2022 strong, increasing 12.6% year over year in January compared to 3.9% in January 2021. All major metropolitan areas covered in the CoreLogic SFRI release experienced year-over-year increases, with Sun Belt cities once again registering the largest gains. The robust price growth was partially due to a continuing shortage of available rental properties. Also, the cost of purchasing a home rose by 19% on an annual basis in January, shutting out many would-be homebuyers and forcing them to keep renting. The year-over-year national rent price growth more than tripled the gain recorded in January 2021 and more than quadrupled the increase from January 2020. “Single-family rent growth extended its record-breaking price growth streak to 10 consecutive months in January,” said Molly Boesel, principal economist at CoreLogic. “Rents increased across the country, and the gains were highest in the Sun Belt, which also had strong population growth last year.” To gain a detailed view of single-family rental prices, CoreLogic examines four tiers of rental prices. National single-family rent growth across the four tiers, and the year-over-year changes, were as follows: Lower-priced (75% or less than the regional median): 12%, up from 3% in January 2021 Differences in rent growth by property type emerged after the pandemic, as renters sought out standalone properties in lower-density areas. This trend drove an acceleration in rent growth for detached rentals in 2021 while the gains for attached rentals was more moderate. However, as rental inventory remains slim, the gap between attached and detached rental growth started to close last fall. In January of 2022, attached rental property prices grew by 12.2% year over year, compared to the 12.4% increase recorded for detached homes. This is the closest that attached and detached growth rates have been since March 2020. The next CoreLogic Single-Family Rent Index will be released on April 19, 2022, featuring data for February 2022. For ongoing housing trends and data, visit the CoreLogic Intelligence Blog: www.corelogic.com/intelligence. Methodology The single-family rental market accounts for half of the rental housing stock, yet unlike the multifamily market, which has many different sources of rent data, there are minimal quality adjusted single-family rent transaction data. The CoreLogic Single-Family Rent Index (SFRI) serves to fill that void by applying a repeat pairing methodology to single-family rental listing data in the Multiple Listing Service. CoreLogic constructed the SFRI for close to 100 metropolitan areas — including 47 metros with four value tiers — and a national composite index. The CoreLogic Single-Family Rent Index analyzes data across four price tiers: Lower-priced, which represent rentals with prices 75% or below the regional median; lower-middle, 75% to 100% of the regional median; higher-middle, 100%-125% of the regional median; and higher-priced, 125% or more above the regional median. Median rent price data is produced monthly by CoreLogic RentalTrends. RentalTrends is built on a database of more than 11 million rental properties (over 75% of all U.S. individual owned rental properties) and covers all 50 states and 17,500 ZIP codes. Source: CoreLogic The data provided is for use only by the primary recipient or the primary recipient’s publication or broadcast. This data may not be re-sold, republished or licensed to any other source, including publications and sources owned by the primary recipient’s parent company without prior written permission from CoreLogic. Any CoreLogic data used for publication or broadcast, in whole or in part, must be sourced as coming from CoreLogic, a data and analytics company. For use with broadcast or web content, the citation must directly accompany first reference of the data. If the data is illustrated with maps, charts, graphs or other visual elements, the CoreLogic logo must be included on screen or website. For questions, analysis or interpretation of the data contact Robin Wachner at newsmedia@corelogic.com. Data provided may not be modified without the prior written permission of CoreLogic. Do not use the data in any unlawful manner. This data is compiled from public records, contributory databases and proprietary analytics, and its accuracy is dependent upon these sources. About CoreLogic CoreLogic is a leading global property information, analytics and data-enabled solutions provider. The company’s combined data from public, contributory and proprietary sources includes over 4.5 billion records spanning more than 50 years, providing detailed coverage of property, mortgages and other encumbrances, consumer credit, tenancy, location, hazard risk and related performance information. The markets CoreLogic serves include real estate and mortgage finance, insurance, capital markets, and the public sector. CoreLogic delivers value to clients through unique data, analytics, workflow technology, advisory and managed services. Clients rely on CoreLogic to help identify and manage growth opportunities, improve performance and mitigate risk. Headquartered in Irvine, Calif., CoreLogic operates in North America, Western Europe and Asia Pacific. For more information, please visit www.corelogic.com. CORELOGIC and the CoreLogic logo are trademarks of CoreLogic, Inc. and/or its subsidiaries. Media Contact
Lower-middle priced (75% to 100% of the regional median): 13.3%, up from 3.2% in January 2021
Higher-middle priced (100% to 125% of the regional median): 13.4%, up from 3.6% inJanuary 2021
Higher-priced (125% or more than the regional median): 12.2%, up from 4.5% in January 2021
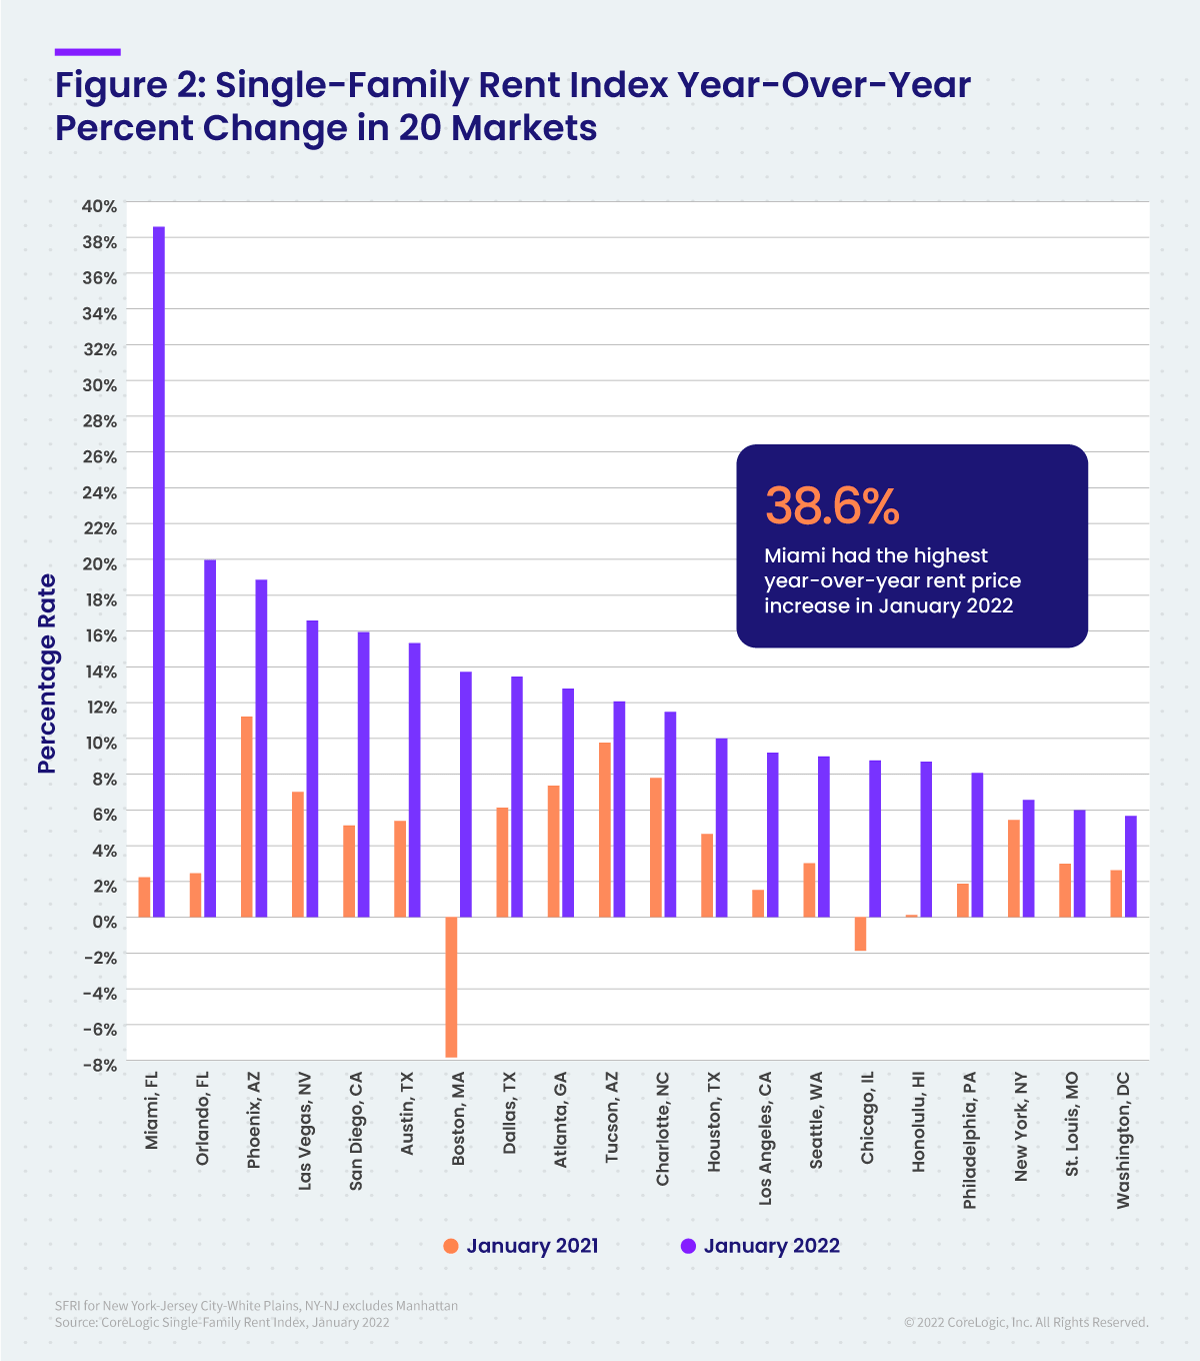
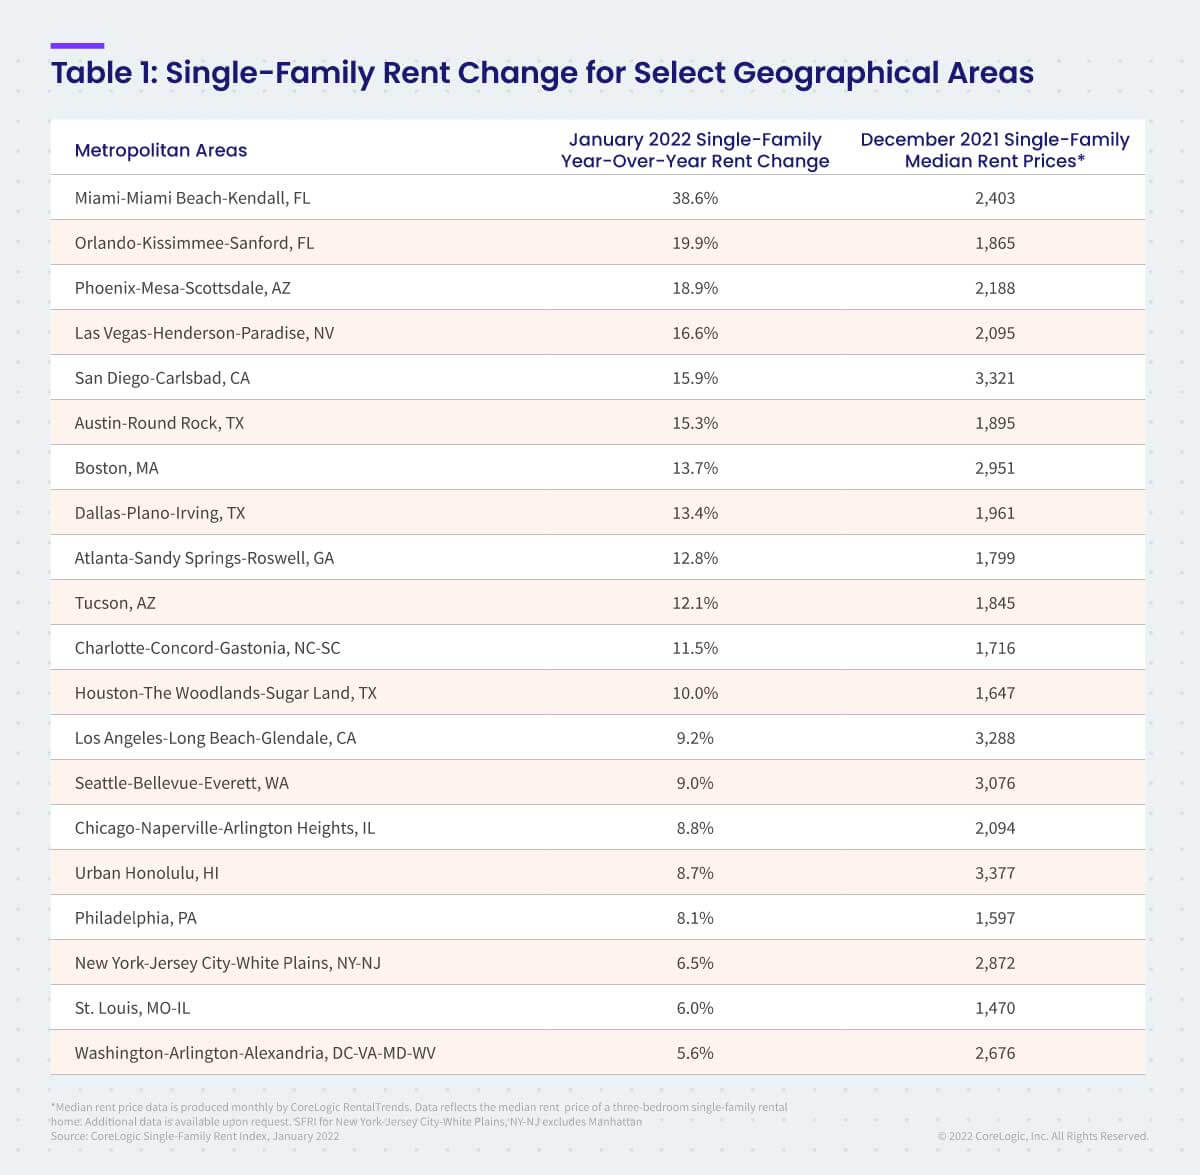
Among the 20 metro areas shown in Table 1, Miami again had the highest year-over-year increase in single-family rents in January 2022 at 38.6%, another significant bump from its January 2021 growth rate of 2.2%. Orlando and Phoenix logged the second- and third-highest gains at 19.9% and 18.9% respectively, reflecting population gains seen in warmer areas of the country. Meanwhile, the Washington, D.C. area recorded the lowest annual rent price growth, at 5.6% in January.
Robin Wachner
CoreLogic
newsmedia@corelogic.com
* All content is copyrighted by Industry Intelligence, or the original respective author or source. You may not recirculate, redistrubte or publish the analysis and presentation included in the service without Industry Intelligence's prior written consent. Please review our terms of use.


