IRVINE, California
,
March 25, 2024
(press release)
–
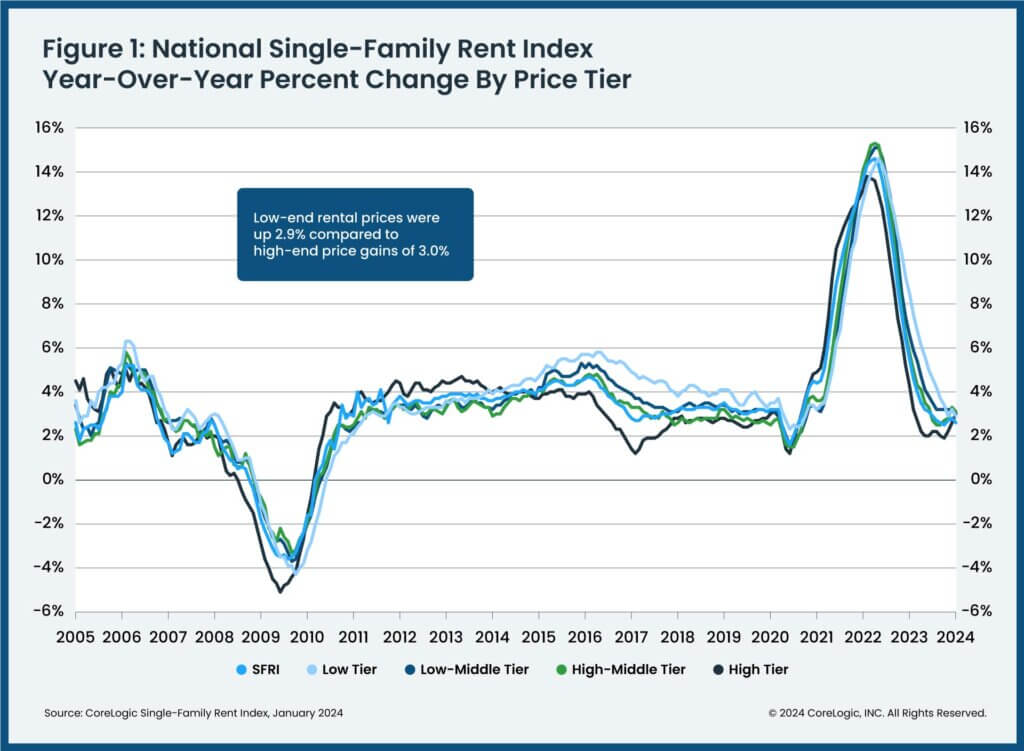
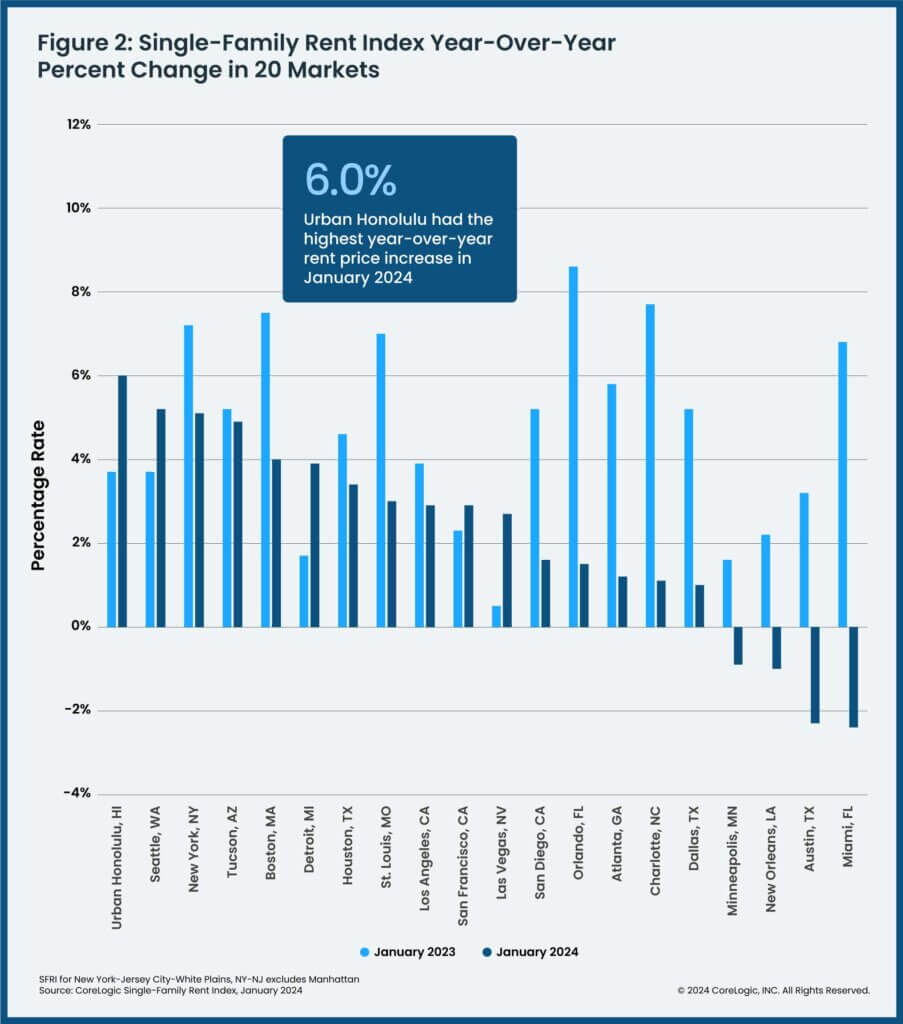
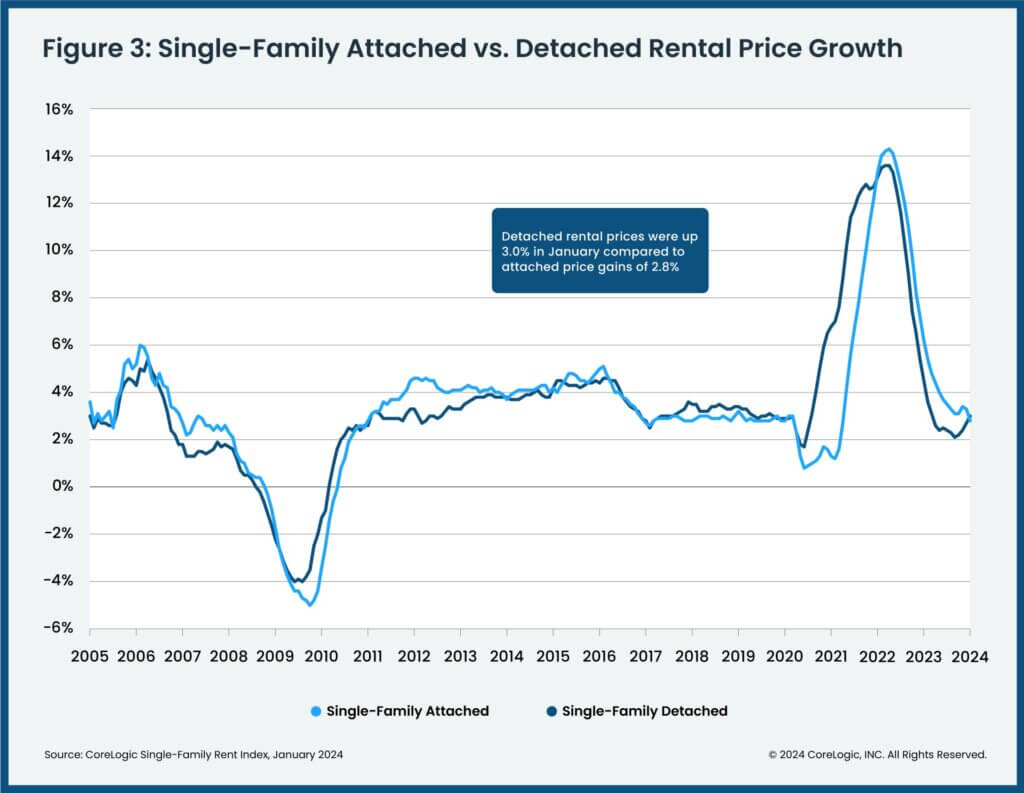
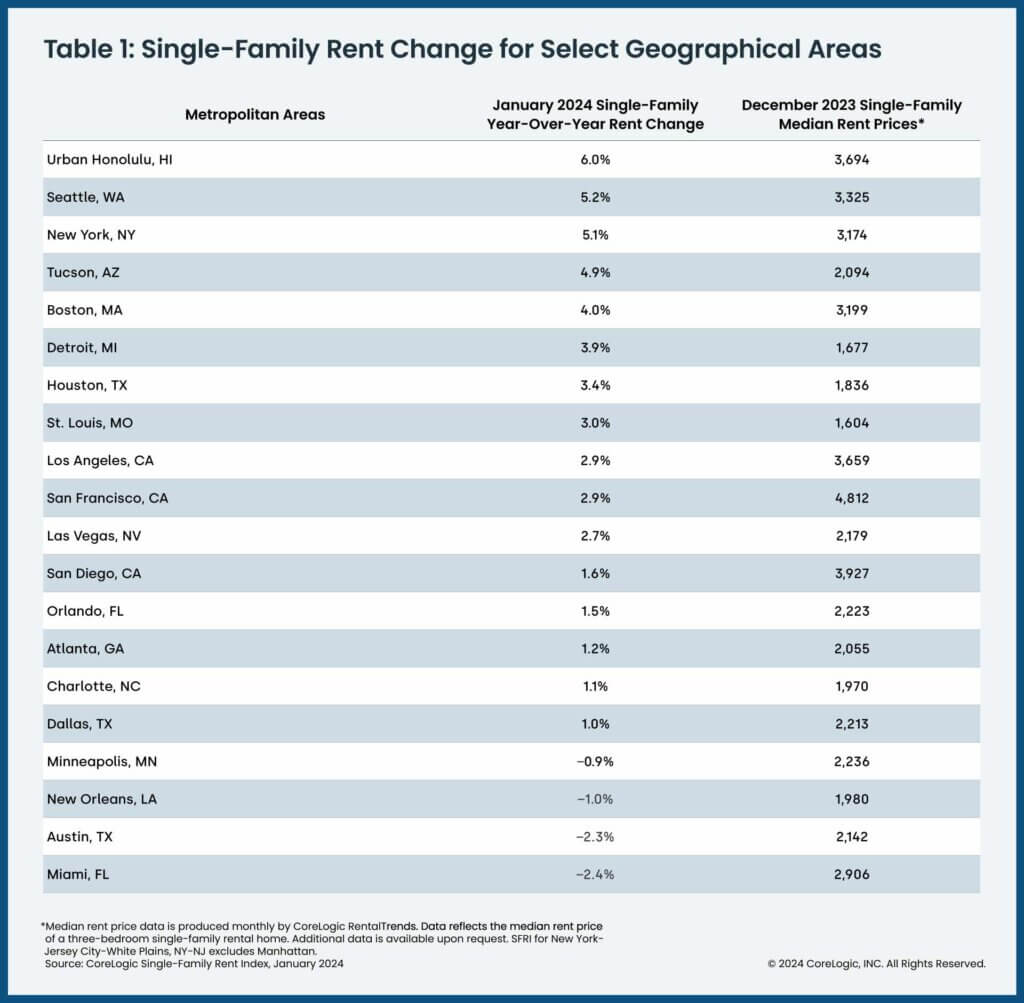
CoreLogic®, a leading global property information, analytics and data-enabled solutions provider, today released its latest Single-Family Rent Index (SFRI), which analyzes single-family rent price changes nationally and across major metropolitan areas. U.S. rent growth slowed in January on both a monthly and yearly basis and has not been in double digits since the fall of 2022. However, overall growth since February 2020 is about 28%, reflecting continued demand for rental properties amidst home prices that remain elevated and continued for-sale inventory shortages. Similarly, while all four price tiers showed nearly identical annual growth of about 3% in January, both the low and high tiers have posted significant gains since the pandemic began, a respective 29.5% and 26.9%. “While annual U.S. single-family rent growth was a moderate 2.6% in January, that increase built on years of above-trend annual gains,” said Molly Boesel, principal economist for CoreLogic. “Furthermore, while rent growth is slowing, costs are still increasing across most of the country. The median rent on a three-bedroom property increased by over $100 in the past year and by more than $500 in the past three years.” To gain a detailed view of single-family rental prices across different market segments, CoreLogic examines four tiers of rental prices and two property-type tiers. National single-family rent growth across those tiers, and the year-over-year changes, were as follows: Of the 20 metros shown in Table 1, Urban Honolulu posted the highest year-over-year increase in single-family rents in January 2024, at 6%. Seattle registered the second-highest annual gain at 5.2%, followed by New York at 5.1%. Four metro areas posted annual rental price losses: Miami (-2.4%); Austin, Texas (-2.3%); New Orleans (-1%) and Minneapolis (-0.9%). The next CoreLogic Single-Family Rent Index will be released on April 16, 2024, featuring data for February 2024. For ongoing housing trends and data, visit the CoreLogic Intelligence Blog: www.corelogic.com/intelligence. Methodology The single-family rental market accounts for half of the rental housing stock, yet unlike the multifamily market, which has many different sources of rent data, there are minimal quality adjusted single-family rent transaction data. The CoreLogic Single-Family Rent Index (SFRI) serves to fill that void by applying a repeat pairing methodology to single-family rental listing data in the Multiple Listing Service. The rental listings used to calculate the index include both attached and detached single-family homes, as well as condominiums. CoreLogic constructed the SFRI for close to 100 metropolitan areas — including 43 metros with four value tiers — and a national composite index. The indices are fully revised with each release to signal turning points sooner. The CoreLogic Single-Family Rent Index analyzes data across four price tiers: Lower-priced, which represent rentals with prices 75% or below the regional median; lower-middle, 75% to 100% of the regional median; higher-middle, 100%-125% of the regional median; and higher-priced, 125% or more above the regional median. Median rent price data is produced monthly by CoreLogic Rental Trends. Rental Trends is built on a database of more than 11 million rental properties (over 75% of all U.S. individual owned rental properties) and covers all 50 states and 17,500 ZIP codes. Source: CoreLogic The data provided is for use only by the primary recipient or the primary recipient’s publication or broadcast. This data may not be re-sold, republished or licensed to any other source, including publications and sources owned by the primary recipient’s parent company without prior written permission from CoreLogic. Any CoreLogic data used for publication or broadcast, in whole or in part, must be sourced as coming from CoreLogic, a data and analytics company. For use with broadcast or web content, the citation must directly accompany first reference of the data. If the data is illustrated with maps, charts, graphs or other visual elements, the CoreLogic logo must be included on screen or website. For questions, analysis or interpretation of the data contact Robin Wachner at newsmedia@corelogic.com. For sales inquiries, please visit https://www.corelogic.com/support/sales-contact/. Data provided may not be modified without the prior written permission of CoreLogic. Do not use the data in any unlawful manner. This data is compiled from public records, contributory databases and proprietary analytics, and its accuracy is dependent upon these sources. About CoreLogic CoreLogic is a leading provider of property insights and innovative solutions, working to transform the property industry by putting people first. Using its network, scale, connectivity and technology, CoreLogic delivers faster, smarter, more human-centered experiences that build better relationships, strengthen businesses and ultimately create a more resilient society. For more information, please visit www.corelogic.com. CORELOGIC and the CoreLogic logo are trademarks of CoreLogic, Inc. and/or its subsidiaries.
* All content is copyrighted by Industry Intelligence, or the original respective author or source. You may not recirculate, redistrubte or publish the analysis and presentation included in the service without Industry Intelligence's prior written consent. Please review our terms of use.


