US real GDP increased in 47 states and DC in Q4 2021, percent change in real GDP ranged from 10.1% in Texas to -2.3% in Iowa; real GDP increased in all 50 states and DC in 2021, ranging from 8.6% in Tennessee to 0.3% in Alaska: Dept. of Commerce

Sample article from our Housing & Economy

WASHINGTON , March 31, 2022 (press release) –

Texas had the largest increase in the fourth quarter

Real gross domestic product (GDP) increased in 47 states and the District of Columbia in the fourth quarter of 2021, as real GDP for the nation increased at an annual rate of 6.9 percent, according to statistics released today by the U.S. Bureau of Economic Analysis. The percent change in real GDP in the fourth quarter ranged from 10.1 percent in Texas to –2.3 percent in Iowa (table 1).

Real GDP increased in 19 of the 21 industry groups for which BEA prepares quarterly state estimates (table 2). Information services; professional, scientific, and technical services; and real estate and rental and leasing were the leading contributors to the increase in real GDP nationally. Professional, scientific, and technical services was the leading contributor to the increase in Texas, the state with the largest increase.

Other highlights

  • Information services increased 20.1 percent nationally and contributed increases in all 50 states and the District of Columbia. This industry was the leading contributor to the increases in five states including California and Washington, the states with the fourth and fifth largest increases.
  • Professional, scientific, and technical services increased 12.3 percent nationally and contributed increases in 49 states and the District of Columbia. This industry was the leading contributor to the increase in six states, including Texas, and the District of Columbia.
  • Real estate and rental and leasing increased 7.1 percent nationally and contributed increases in all 50 states and the District of Columbia. This industry was the leading contributor to the increases in eight states including Tennessee and Oregon, the states with the second and third largest increases.
  • Agriculture, forestry, fishing, and hunting was the leading contributor to decreases in real GDP in Iowa, North Dakota, and Nebraska.

Coronavirus (COVID-19) Impact on Fourth-Quarter 2021 and 2021 GDP by State Estimates
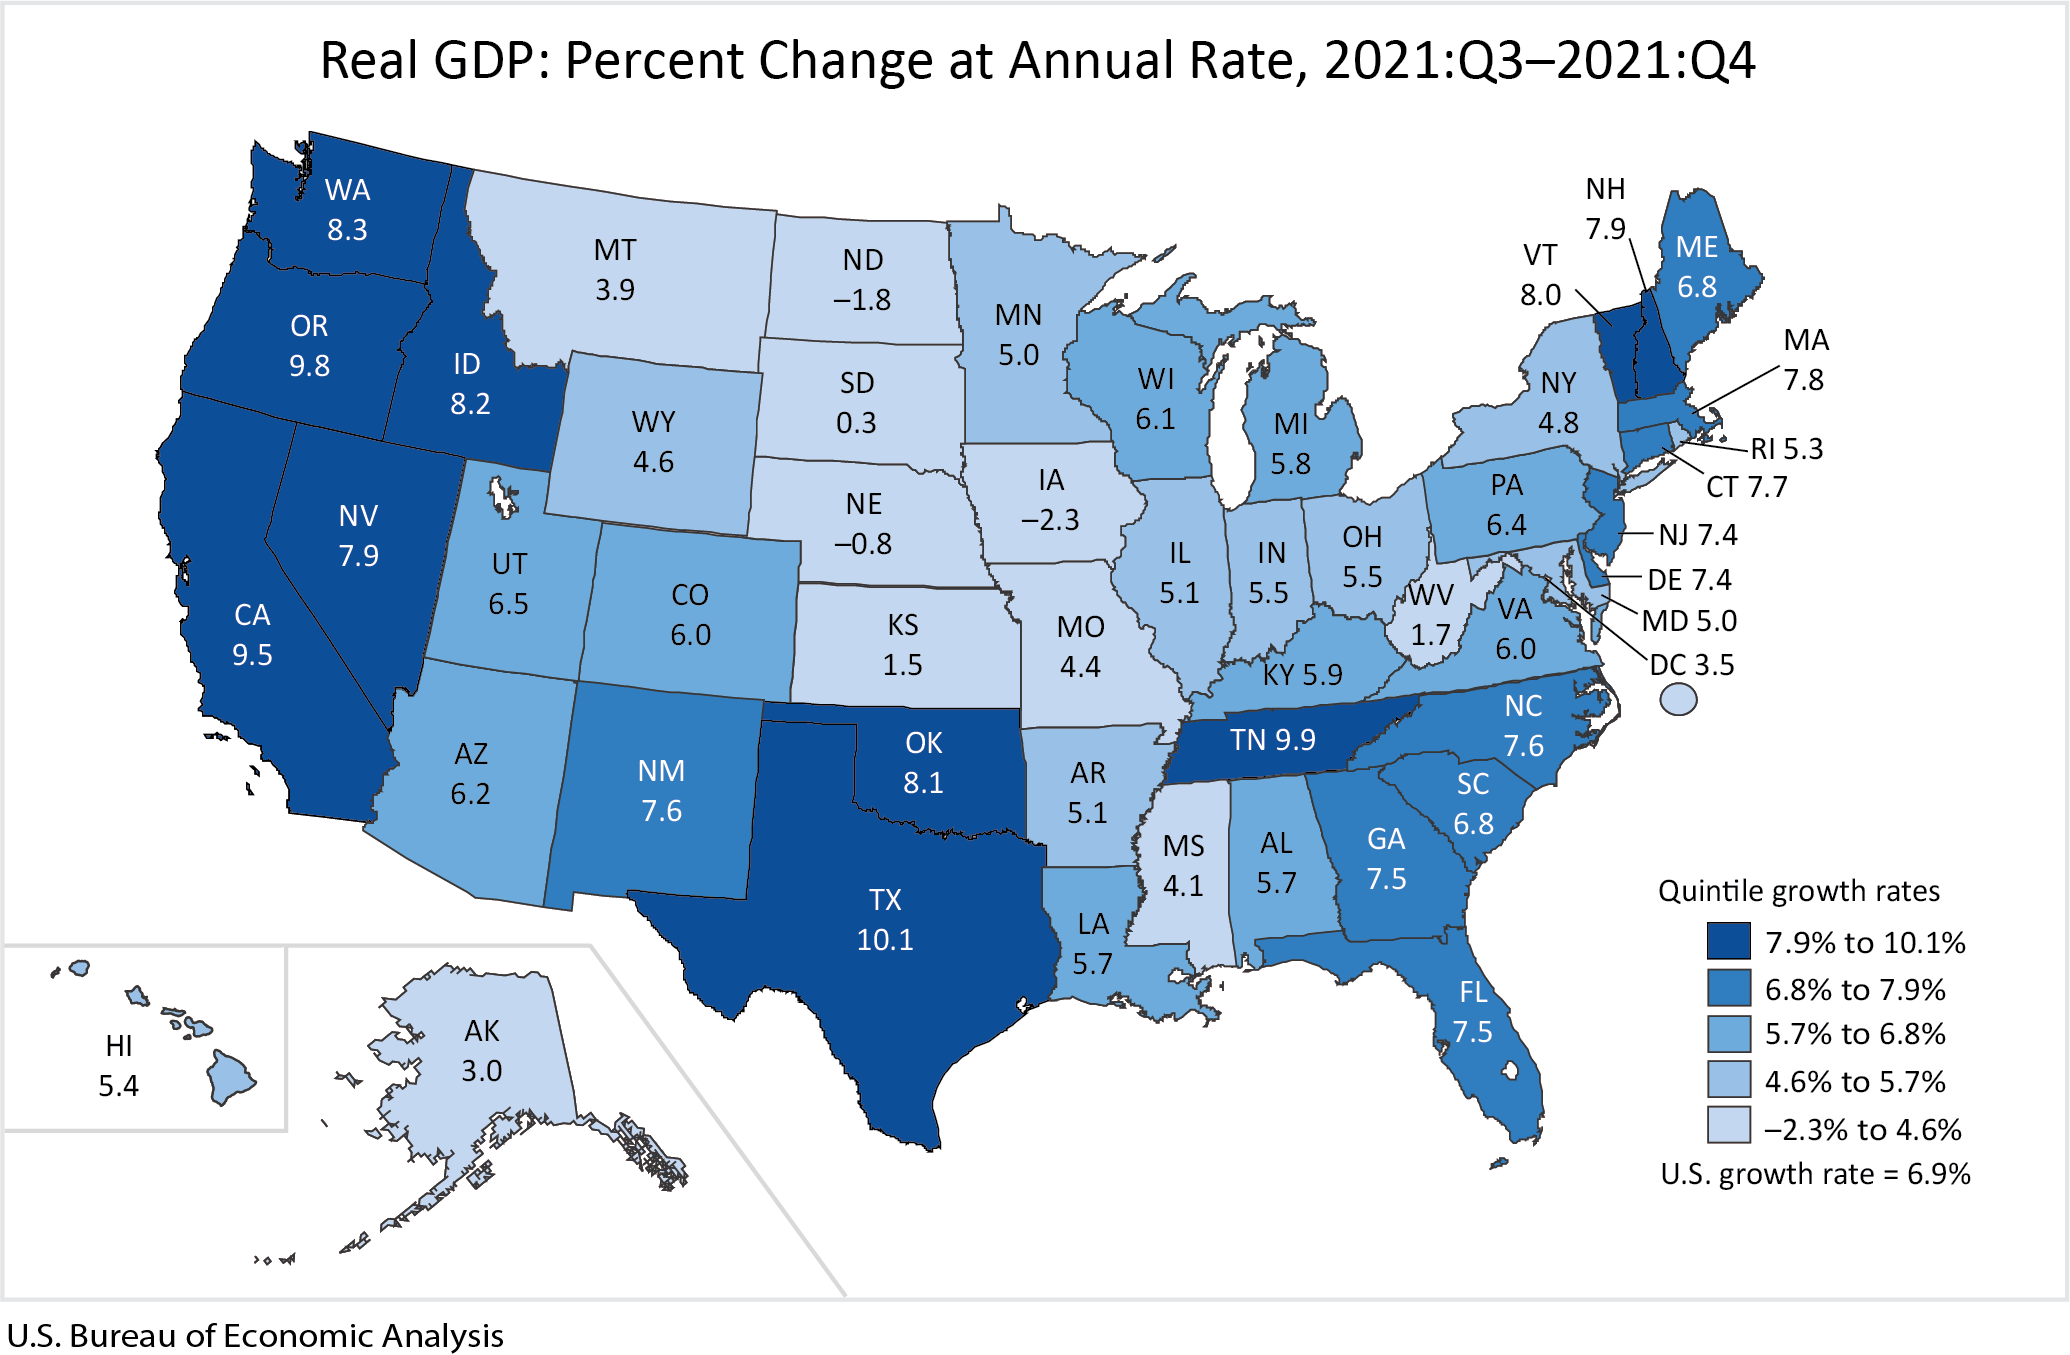
The fourth-quarter 2021 and 2021 annual estimates of GDP by state reflect the continued economic impacts related to the COVID-19 pandemic. The fourth-quarter estimates reflect an increase in COVID-19 cases resulting in continued restrictions and disruptions in the operations of establishments in some parts of the country. Government assistance payments in the form of forgivable loans to businesses and social benefits to households all decreased as provisions of several federal programs expired or tapered off.

The 2021 annual estimates reflect the continued economic recovery, reopening of establishments, and continued government response related to the COVID-19 pandemic. The full economic effects of the COVID-19 pandemic cannot be quantified in the GDP by state estimates because the impacts are generally embedded in source data and cannot be separately identified. For more information, see "Federal Recovery Programs and BEA Statistics."

GDP by State, Annual 2021
Real GDP increased in all 50 states and the District of Columbia in 2021. The percent change in real GDP ranged from 8.6 percent in Tennessee to 0.3 percent in Alaska (table 4).

Finance and insurance; information services; and professional, scientific, and technical services were the leading contributors to the increase in real GDP nationally. Finance and insurance was the leading contributor to the increase in Tennessee, the state with largest increase (table 5).

Other highlights

  • Finance and insurance contributed to the increases in all 50 states and the District of Columbia. This industry was also the leading contributor to the increases in 10 states.
  • Information services contributed to the increases in all 50 states and the District of Columbia. This industry was also the leading contributor to the increases in four states including California, the state with the third largest increase.
  • Professional, scientific, and technical services contributed to the increases in 49 states and the District of Columbia. This industry was also the leading contributor to the increases in seven states and the District of Columbia.
     

Next release: June 30, 2022, at 10:00 A.M. EDT
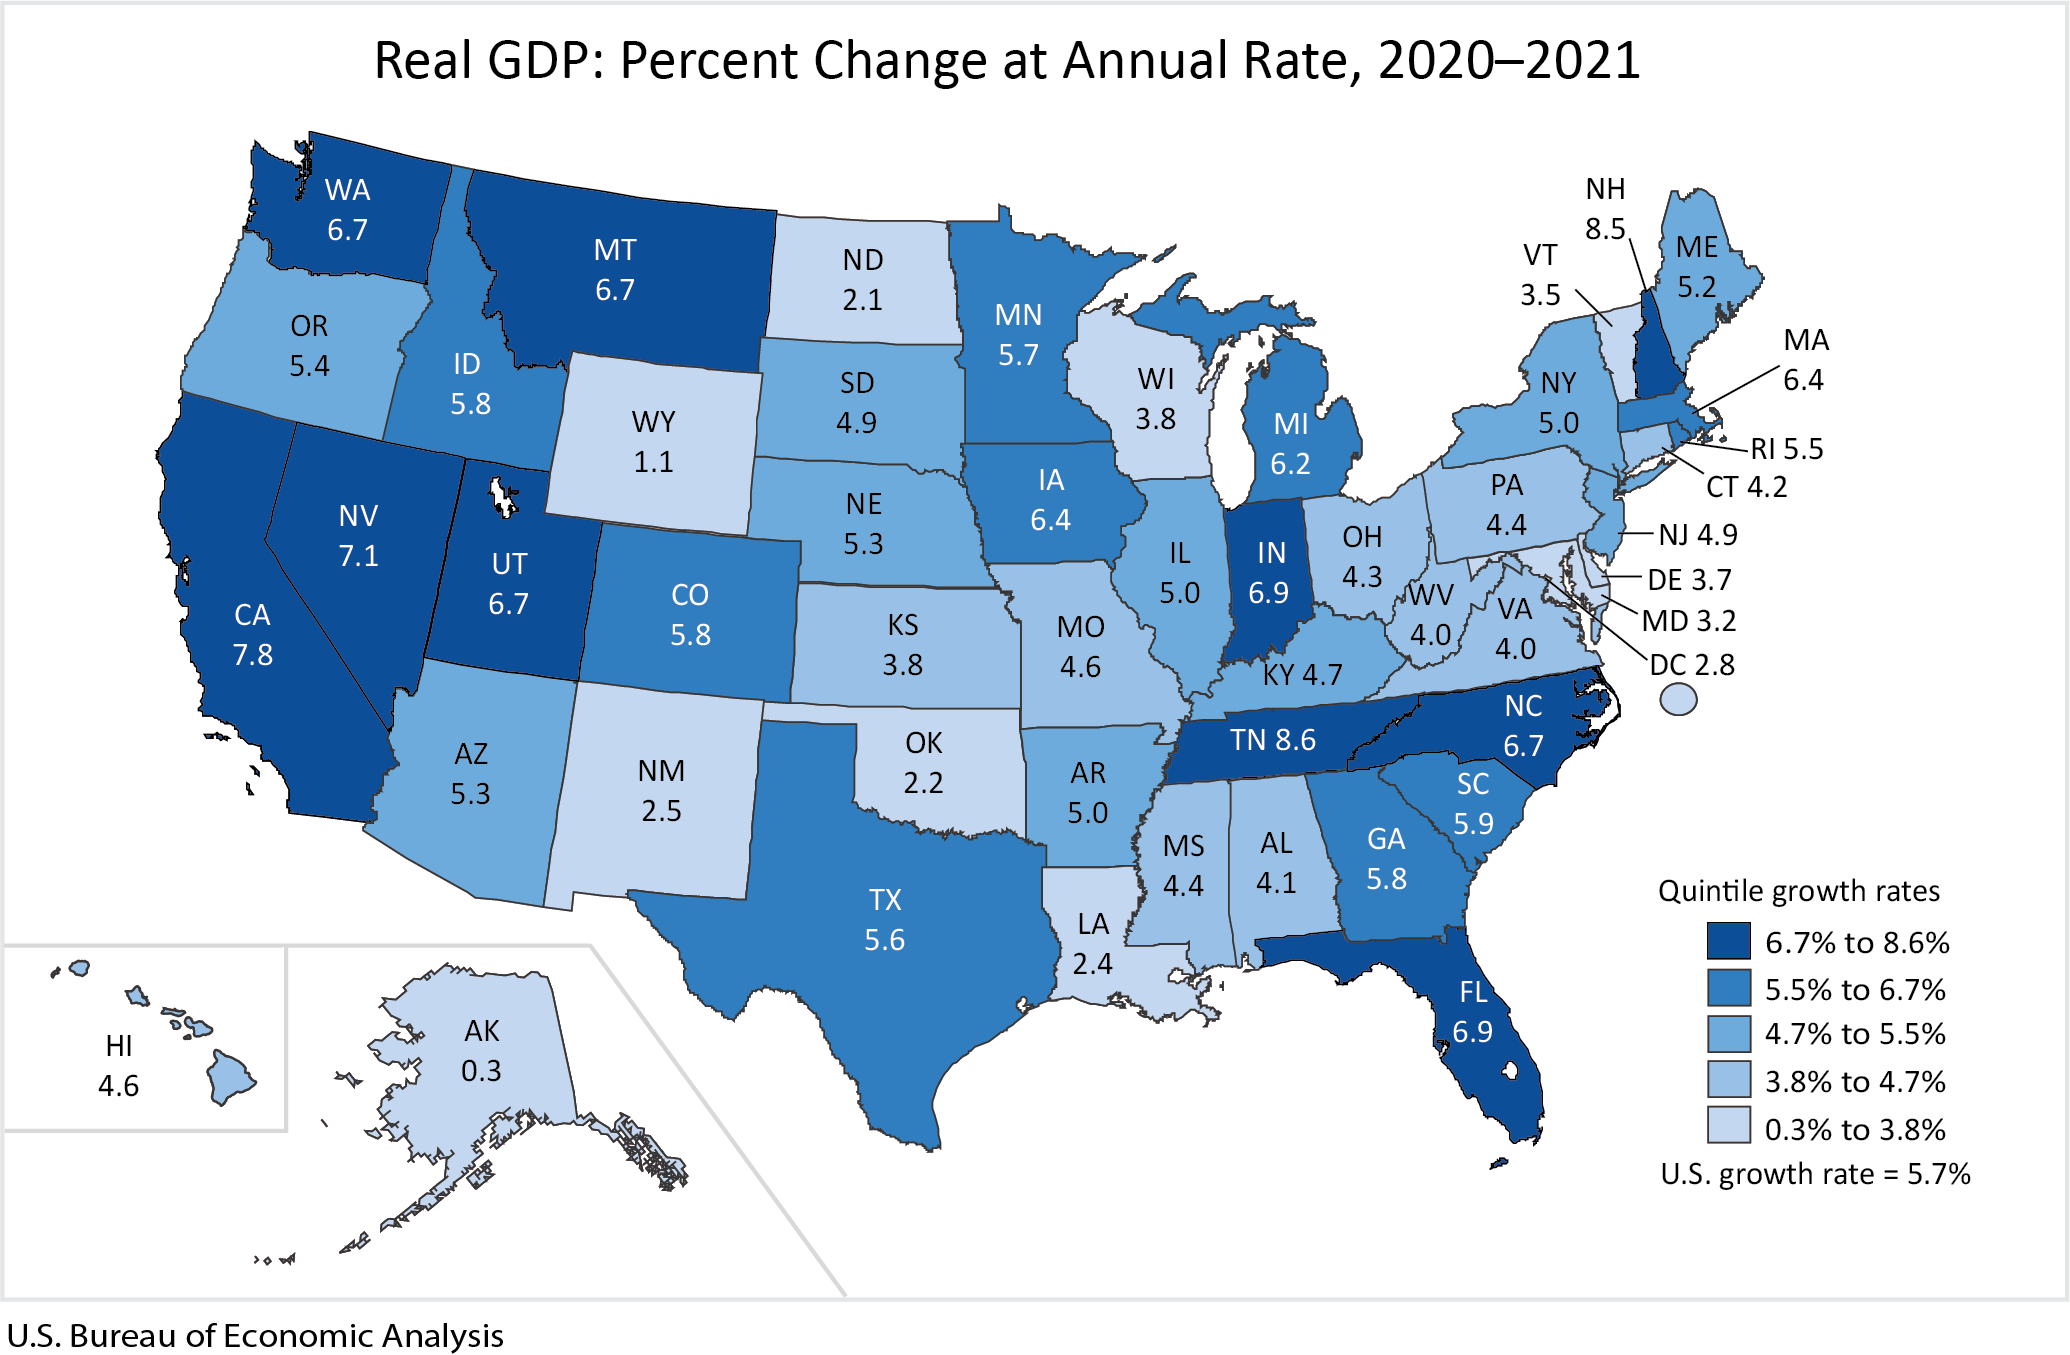
Gross Domestic Product by State, 1st Quarter 2022

* All content is copyrighted by Industry Intelligence, or the original respective author or source. You may not recirculate, redistrubte or publish the analysis and presentation included in the service without Industry Intelligence's prior written consent. Please review our terms of use.

More from our Housing & Economy Coverage
See our dashboard in action - schedule an demo
Dan Rivard
Dan Rivard
- VP Market Development -

We offer built-to-order housing & economy coverage for our clients. Contact us for a free consultation.

About Us

We deliver market news & information relevant to your business.

We monitor all your market drivers.

We aggregate, curate, filter and map your specific needs.

We deliver the right information to the right person at the right time.

Our Contacts

1990 S Bundy Dr. Suite #380,
Los Angeles, CA 90025

+1 (310) 553 0008

About Cookies On This Site

We collect data, including through use of cookies and similar technology ("cookies") that enchance the online experience. By clicking "I agree", you agree to our cookies, agree to bound by our Terms of Use, and acknowledge our Privacy Policy. For more information on our data practices and how to exercise your privacy rights, please see our Privacy Policy.