WASHINGTON
,
July 5, 2023
(press release)
–
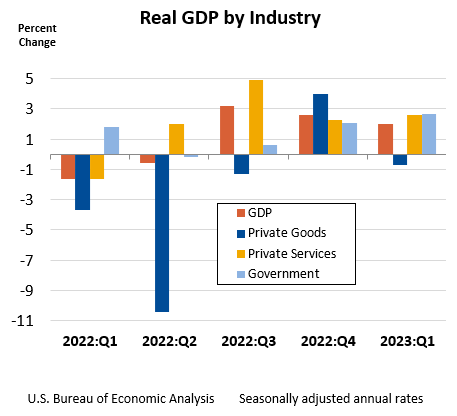
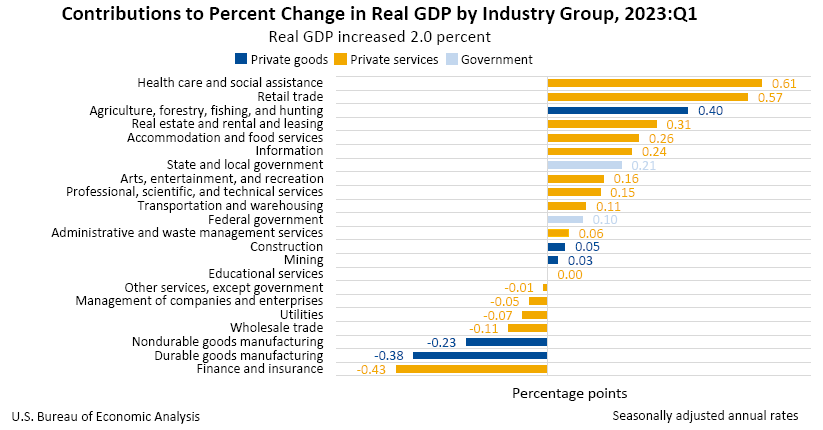
Real gross domestic product (GDP) increased at an annual rate of 2.0 percent in the first quarter of 2023 (table 1), according to the "third" estimate released by the Bureau of Economic Analysis. In the fourth quarter, real GDP increased 2.6 percent. The GDP estimate released today is based on more complete source data than were available for the "second" estimate issued last month. In the second estimate, the increase in real GDP was 1.3 percent. The updated estimates primarily reflected upward revisions to exports and consumer spending that were partly offset by downward revisions to nonresidential fixed investment and federal government spending. Imports, which are a subtraction in the calculation of GDP, were revised down (refer to "Updates to GDP"). The increase in real GDP in the first quarter reflected increases in consumer spending, exports, state and local government spending, federal government spending, and nonresidential fixed investment that were partly offset by decreases in private inventory investment and residential fixed investment. Imports increased (table 2). Compared to the fourth quarter, the deceleration in real GDP in the first quarter primarily reflected Current‑dollar GDP increased 6.1 percent at an annual rate, or $391.8 billion, in the first quarter to a level of $26.53 trillion, an upward revision of $43.5 billion from the previous estimate (tables 1 and 3). More information on the source data that underlie the estimates is available in the "Key Source Data and Assumptions" file on BEA's website. The price index for gross domestic purchases increased 3.8 percent in the first quarter, the same as the previous estimate (table 4). The personal consumption expenditures (PCE) price index increased 4.1 percent, revised down 0.1 percentage point. The PCE price index excluding food and energy prices increased 4.9 percent, a downward revision of 0.1 percentage point. Current-dollar personal income increased $278.0 billion in the first quarter, an upward revision of $26.7 billion from the previous estimate. The increase primarily reflected increases in compensation (led by private wages and salaries) and personal current transfer receipts (led by government social benefits) (table 8). Disposable personal income increased $587.9 billion, or 12.9 percent, in the first quarter, an upward revision of $26.4 billion from the previous estimate. Real disposable personal income increased 8.5 percent, an upward revision of 0.7 percentage point. Personal saving was $840.9 billion in the first quarter, an upward revision of $11.6 billion from the previous estimate. The personal saving rate——personal saving as a percentage of disposable personal income—was 4.3 percent in the first quarter, an upward revision of 0.1 percentage point. Real gross domestic income (GDI) decreased 1.8 percent in the first quarter, an upward revision of 0.5 percentage point from the previous estimate. The average of real GDP and real GDI, a supplemental measure of U.S. economic activity that equally weights GDP and GDI, increased 0.1 percent in the first quarter, an upward revision of 0.6 percentage point from the previous estimate. Profits from current production (corporate profits with inventory valuation and capital consumption adjustments) decreased $121.5 billion in the first quarter, an upward revision of $29.7 billion from the previous estimate (table 10). Profits of domestic financial corporations decreased $9.4 billion in the first quarter, an upward revision of $16.0 billion from the previous estimate. Profits of domestic nonfinancial corporations decreased $102.9 billion, an upward revision of $6.5 billion. Rest-of-the-world profits (net) decreased $9.2 billion, an upward revision of $7.2 billion. In the first quarter, receipts increased $9.4 billion, and payments increased $18.6 billion. The increase in first-quarter real GDP was revised up 0.7 percentage point from the second estimate, reflecting upward revisions to exports, consumer spending, state and local government spending, and residential fixed investment that were partly offset by downward revisions to nonresidential fixed investment, federal government spending, and private inventory investment. Imports were revised down. For more information, refer to the Technical Note. For information on updates to GDP, refer to the "Additional Information" section that follows. Today's release includes estimates of real GDP by industry, or value added—a measure of an industry's contribution to GDP. In the first quarter, the value added of private services-producing industries increased 2.6 percent, government increased 2.7 percent, and private goods-producing industries decreased 0.7 percent (table 12). Overall, 15 of 22 industry groups contributed to the first-quarter increase in real GDP (table 13). Real gross output—principally a measure of an industry's sales or receipts, which includes sales to final users in the economy (GDP) and sales to other industries (intermediate inputs)—increased 2.7 percent in the first quarter, reflecting increases of 0.4 percent for private goods-producing industries, 3.4 percent for private services-producing industries, and 3.7 percent for government (table 16). Overall, 16 of 22 industry groups contributed to the first-quarter increase in real gross output.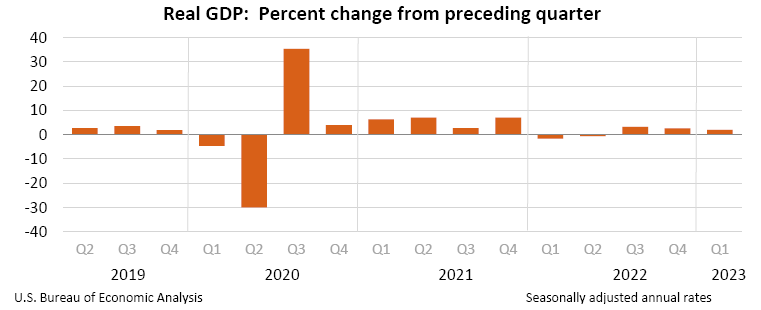
a downturn in private inventory investment and a slowdown in nonresidential fixed investment that were partly offset by an acceleration in consumer spending, an upturn in exports, and a smaller decrease in residential fixed investment. Imports turned up.Personal Income
Gross Domestic Income and Corporate Profits
Updates to GDP
Advance Estimate
Second Estimate
Third Estimate
(Percent change from preceding quarter)
Real GDP
1.1
1.3
2.0
Current-dollar GDP
5.1
5.4
6.1
Real GDI
…
-2.3
-1.8
Average of Real GDP and Real GDI
…
-0.5
0.1
Gross domestic purchases price index
3.8
3.8
3.8
PCE price index
4.2
4.2
4.1
PCE price index excluding food and energy
4.9
5.0
4.9
Real GDP by Industry
Gross Output by Industry
* All content is copyrighted by Industry Intelligence, or the original respective author or source. You may not recirculate, redistrubte or publish the analysis and presentation included in the service without Industry Intelligence's prior written consent. Please review our terms of use.


