WASHINGTON
,
July 28, 2022
(press release)
–
Real gross domestic product (GDP) decreased at an annual rate of 0.9 percent in the second quarter of 2022 (table 1), according to the "advance" estimate released by the Bureau of Economic Analysis. In the first quarter, real GDP decreased 1.6 percent. The GDP estimate released today is based on source data that are incomplete or subject to further revision by the source agency (refer to "Source Data for the Advance Estimate" on page 3). The "second" estimate for the second quarter, based on more complete data, will be released on August 25, 2022. The decrease in real GDP reflected decreases in private inventory investment, residential fixed investment, federal government spending, state and local government spending, and nonresidential fixed investment that were partly offset by increases in exports and personal consumption expenditures (PCE). Imports, which are a subtraction in the calculation of GDP, increased (table 2). The decrease in private inventory investment was led by a decrease in retail trade (mainly general merchandise stores as well as motor vehicle dealers). The decrease in residential fixed investment was led by a decrease in "other" structures (specifically brokers' commissions). The decrease in federal government spending reflected a decrease in nondefense spending that was partly offset by an increase in defense spending. The decrease in nondefense spending reflected the sale of crude oil from the Strategic Petroleum Reserve, which results in a corresponding decrease in consumption expenditures. Because the oil sold by the government enters private inventories, there is no direct net effect on GDP. The decrease in state and local government spending was led by a decrease in investment in structures. The decrease in nonresidential fixed investment reflected decreases in structures and equipment that were mostly offset by an increase in intellectual property products. The increase in imports reflected an increase in services (led by travel). The increase in exports reflected increases in both goods (led by industrial supplies and materials) and services (led by travel). The increase in PCE reflected an increase in services (led by food services and accommodations as well as health care) that was partly offset by a decrease in goods (led by food and beverages). Real GDP decreased less in the second quarter than in the first quarter, decreasing 0.9 percent after decreasing 1.6 percent. The smaller decrease reflected an upturn in exports and a smaller decrease in federal government spending that were partly offset by larger declines in private inventory investment and state and local government spending, a slowdown in PCE, and downturns in nonresidential fixed investment and residential fixed investment. Imports decelerated. Current‑dollar GDP increased 7.8 percent at an annual rate, or $465.1 billion, in the second quarter to a level of $24.85 trillion. In the first quarter, GDP increased 6.6 percent, or $383.9 billion (tables 1 and 3). The price index for gross domestic purchases increased 8.2 percent in the second quarter, compared with an increase of 8.0 percent in the first quarter (table 4). The PCE price index increased 7.1 percent, the same rate as the first quarter. Excluding food and energy prices, the PCE price index increased 4.4 percent, compared with an increase of 5.2 percent. Personal Income Current-dollar personal income increased $353.8 billion in the second quarter, compared with an increase of $247.2 billion in the first quarter. The increase primarily reflected increases in compensation (led by private wages and salaries), proprietors' income (both nonfarm and farm), personal income receipts on assets, and rental income (table 8). Disposable personal income increased $291.4 billion, or 6.6 percent, in the second quarter, in contrast to a decrease of $58.8 billion, or 1.3 percent, in the first quarter. Real disposable personal income decreased 0.5 percent, compared with a decrease of 7.8 percent. Personal saving was $968.4 billion in the second quarter, compared with $1.02 trillion in the first quarter. The personal saving rate—personal saving as a percentage of disposable personal income—was 5.2 percent in the second quarter, compared with 5.6 percent in the first quarter. Source Data for the Advance Estimate Information on the source data and key assumptions used in the advance estimate is provided in a Technical Note that is posted with the news release on BEA's website. A detailed "Key Source Data and Assumptions" file is also posted for each release. For information on updates to GDP, refer to the "Additional Information" section that follows. Annual Update of the National Economic Accounts Next release, August 25, 2022, at 8:30 a.m. EDT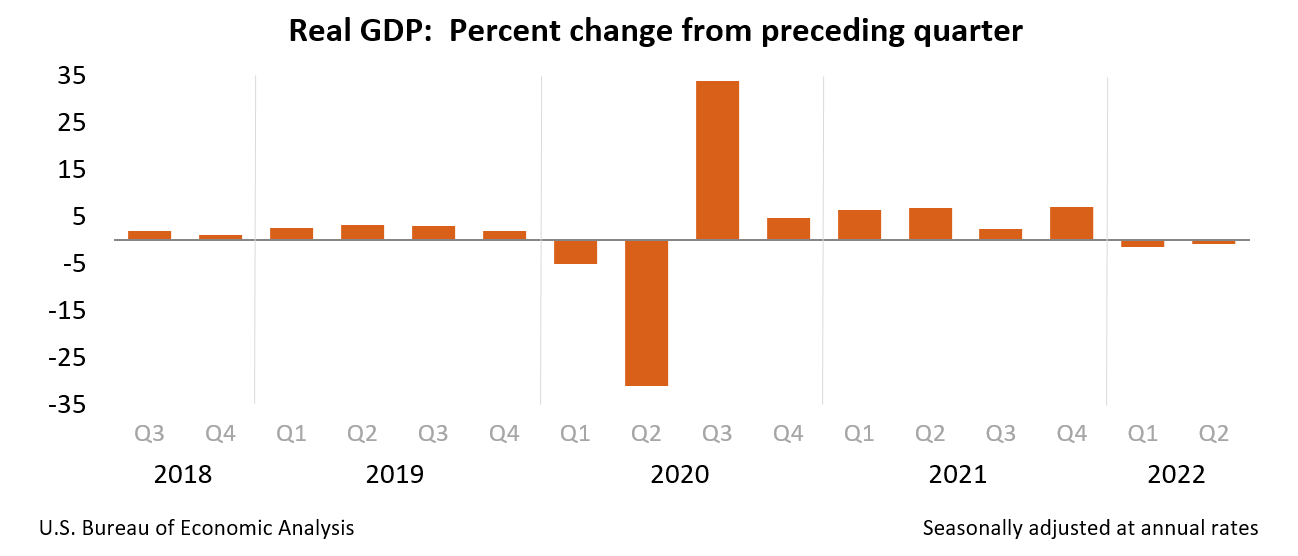
BEA will release results from the 2022 annual update of the National Economic Accounts, which includes the National Income and Product Accounts as well as the Industry Economic Accounts, on September 29, 2022. This update will present revised statistics for GDP, GDP by Industry, and gross domestic income that cover the first quarter of 2017 through the first quarter of 2022. For details, refer to Information on Updates to the National Economic Accounts.
* * *
Gross Domestic Product (Second Estimate)
Corporate Profits (Preliminary Estimate)
Second Quarter 2022
* All content is copyrighted by Industry Intelligence, or the original respective author or source. You may not recirculate, redistrubte or publish the analysis and presentation included in the service without Industry Intelligence's prior written consent. Please review our terms of use.


