WASHINGTON
,
September 29, 2022
(press release)
–
Real gross domestic product (GDP) decreased at an annual rate of 0.6 percent in the second quarter of 2022 (table 1), according to the "third" estimate released by the Bureau of Economic Analysis. In the first quarter, real GDP decreased 1.6 percent (same as previously published). The “third” estimate of GDP released today is based on more complete source data than were available for the "second" estimate issued last month. In the second estimate, the decrease in real GDP was also 0.6 percent. The update primarily reflected an upward revision to consumer spending that was offset by a downward revision to exports. Imports, which are a subtraction in the calculation of GDP, were revised down (refer to "Updates to GDP"). The decrease in real GDP reflected decreases in private inventory investment, residential fixed investment, federal government spending, and state and local government spending, that were partly offset by increases in exports and consumer spending. Imports, which are a subtraction in the calculation of GDP, increased (table 2). The decrease in private inventory investment was led by a decrease in retail trade (mainly “other” general merchandise stores). The decrease in residential fixed investment was led by a decrease in "other" structures (specifically real estate brokers' commissions). The decrease in federal government spending reflected a decrease in nondefense spending that was partly offset by an increase in defense spending. The decrease in nondefense spending reflected the sale of crude oil from the Strategic Petroleum Reserve, which results in a corresponding decrease in consumption expenditures. Because the oil sold by the government enters private inventories, there is no direct net effect on GDP. The decrease in state and local government spending was led by a decrease in investment in structures. The increase in imports reflected an increase in services (led by travel). The increase in exports reflected increases in both goods (led by industrial supplies and materials) and services (led by travel). The increase in consumer spending reflected an increase in services (led by food services and accommodations as well as “other” services) that was partly offset by a decrease in goods (led by food and beverages). Real GDP decreased less in the second quarter than in the first quarter, decreasing 0.6 percent after decreasing 1.6 percent. The smaller decrease reflected an upturn in exports, an acceleration in consumer spending, and a smaller decrease in federal government spending that were partly offset by a downturn in private inventory investment, a deceleration in nonresidential fixed investment, and a larger decrease in residential fixed investment. Imports decelerated. Current‑dollar GDP increased 8.5 percent at an annual rate, or $508.0 billion, in the second quarter to a level of $25.25 trillion (tables 1 and 3), an upward revision in change1 of $11.9 billion from the previous estimate. More information on the source data that underlie the estimates is available in the "Key Source Data and Assumptions" file on BEA's website. The price index for gross domestic purchases increased 8.5 percent in the second quarter (table 4), an upward revision of 0.1 percentage point from the previous estimate. The personal consumption expenditures (PCE) price index increased 7.3 percent, an upward revision of 0.2 percentage point. Excluding food and energy, the PCE price index increased 4.7 percent, an upward revision of 0.3 percentage point. Personal Income Current-dollar personal income increased $305.7 billion in the second quarter, a downward revision in change of $47.4 billion from the previous estimate. The increase primarily reflected increases in compensation (led by private wages and salaries) and personal income receipts on assets (table 8). Disposable personal income increased $253.3 billion, or 5.7 percent, in the second quarter, a downward revision of 0.8 percentage point from the previous estimate. Real disposable personal income decreased 1.5 percent, a downward revision of 0.9 percentage point. Personal saving was $629.0 billion in the second quarter, a downward revision in change of $78.0 billion from the previous estimate. The personal saving rate—personal saving as a percentage of disposable personal income—was 3.4 percent in the second quarter, a downward revision in change of 0.4 percentage point. Gross Domestic Income and Corporate Profits Real gross domestic income (GDI) increased 0.1 percent in the second quarter, a downward revision of 1.3 percentage points from the previous estimate. The average of real GDP and real GDI, a supplemental measure of U.S. economic activity that equally weights GDP and GDI, decreased 0.3 percent in the second quarter, a downward revision of 0.7 percentage point (table 1). Profits from current production (corporate profits with inventory valuation and capital consumption adjustments) increased $131.6 billion in the second quarter, a downward revision in change of $43.5 billion from the previous estimate (table 10). Profits of domestic financial corporations decreased $46.0 billion in the second quarter, a downward revision in change of $21.8 billion. Profits of domestic nonfinancial corporations increased $152.2 billion, a downward revision in change of $21.7 billion. Rest-of-the-world profits increased $25.5 billion, a downward revision in change of $0.1 billion. In the second quarter, receipts increased $56.1 billion, and payments increased $30.6 billion. Updates to GDP The 0.6 percent decrease in second-quarter real GDP was the same as previously estimated in the “second” estimate. Upward revisions to consumer spending, federal government spending, and nonresidential fixed investment were offset by downward revisions to exports, residential fixed investment, and private inventory investment. Imports, which are a subtraction in the calculation of GDP, were revised down. For more information, refer to the Technical Note. For information on updates to GDP, refer to the "Additional Information" section that follows. Real GDP by Industry Within private goods-producing industries, the leading contributors to the decrease were construction and nondurable goods manufacturing (led by chemical products manufacturing) (table 13). Gross Output by Industry Annual Update of the National Economic Accounts Today’s release presents results from the Annual Update of the National Economic Accounts (NEAs), which includes the National Income and Product Accounts (NIPAs) as well as the Industry Economic Accounts. The update includes revised estimates for the first quarter of 2017 through the first quarter of 2022 and resulted in revisions to GDP, GDP by industry, GDI, and their major components. The reference year remains 2012. More information on the 2022 Annual Update is found in the "Preview of the 2022 Annual Update of the National Economic Accounts" in the May Survey of Current Business. With today's release, most NIPA tables are available through BEA’s Interactive Data application on the BEA website (www.bea.gov). Refer to Information on Updates to the National Economic Accounts for the complete table release schedule and a summary of results through 2021, which includes a discussion of methodology changes. A table showing the major current dollar revisions and their sources for each component of GDP, national income, and personal income is also provided. The November 2022 Survey of Current Business will contain an article describing the update in more detail. The updated estimates show that real GDP increased at an average annual rate of 2.1 percent from 2016 to 2021, 0.2 percentage point higher than the previously published estimate. Over the same period, real GDI also increased 2.1 percent, 0.2 percentage point lower than previously published. The average of real GDP and real GDI over the same period was 2.1 percent, the same as previously published. For the period of economic expansion from the second quarter of 2009 through the fourth quarter of 2019, real GDP increased at an annual rate of 2.3 percent, the same as previously published. For the period of economic contraction from the fourth quarter of 2019 through the second quarter of 2020, real GDP decreased at an annual rate of 18.2 percent, 1.0 percentage point higher than previously published. For the period of economic expansion from the second quarter of 2020 through the first quarter of 2022, real GDP increased at an annual rate of 8.1 percent, 0.2 percentage point higher than previously estimated. Previously published estimates, which are superseded by today's release, are found in BEA’s archives. Updates for the First Quarter of 2022 For the first quarter of 2022, real GDP is now estimated to have decreased 1.6 percent (table 1), the same as previously published. Downward revisions to consumer spending (specifically services), nonresidential fixed investment, and residential fixed investment were offset by upward revisions to private inventory investment, federal government spending, exports, and state and local government spending. Imports were revised down. The price index for gross domestic purchases is now estimated to have increased 8.1 percent in the first quarter, 0.1 percentage point higher than previously published (table 4). The PCE price index increased 7.5 percent, 0.4 percentage point higher than previously published. Excluding food and energy prices, the PCE price index increased 5.6 percent, 0.4 percentage point higher than previously published. Personal Income Current-dollar personal income is now estimated to have increased $157.7 billion in the first quarter, a downward revision in change of $89.5 billion from the previous estimate. The revision primarily reflected a downward revision to compensation (led by private wages and salaries) (table 8). Disposable personal income decreased $181.7 billion, or 3.9 percent, in the first quarter, a downward revision in change of $122.9 billion from the previous estimate. Real disposable personal income decreased 10.6 percent, a downward revision of 2.8 percentage points. Personal saving was $784.9 billion in the first quarter, a downward revision in change of $128.4 billion from the previous estimate. The personal saving rate—personal saving as a percentage of disposable personal income—was 4.3 percent in the first quarter, a downward revision in change of 0.7 percentage point. Gross Domestic Income and Corporate Profits Real GDI is now estimated to have increased 0.8 percent in the first quarter (table 1); in the previously published estimates, first-quarter GDI was estimated to have increased 1.8 percent. The leading contributor to the downward revision was compensation, based primarily on new first-quarter wage and salary estimates from the Bureau of Labor Statistics’ Quarterly Census of Employment and Wages. The average of real GDP and real GDI is now estimated to have decreased 0.4 percent in the first quarter; in the previously published estimates, the average of GDP and GDI was estimated to have increased 0.1 percent. Profits from current production (corporate profits with inventory valuation and capital consumption adjustments) is now estimated to have increased $3.7 billion in the first quarter, an upward revison in change of $67.6 billion (table 10). Profits of domestic financial corporations decreased $26.8 billion, an upward revision in change of $24.3 billion. Profits of domestic nonfinancial corporations increased $16.4 billion, an upward revision in change of $21.2 billion. Rest-of-the-world profits increased $14.2 billion, an upward revision in change of $22.1 billion. In the first quarter, receipts are now estimated to have increased $17.1 billion, and payments are now estimated to have increased $2.9 billion. GDP by Industry In the first quarter, real value added for private goods-producing industries is now estimated to have decreased 3.7 percent, an upward revision of 3.2 percentage point. Private services-producing industries decreased 1.6 percent, a downward revision of 0.8 percentage point. Government increased 1.8 percent, a downward revision of 0.2 percentage point (table 12). Real gross output is now estimated to have increased 2.4 percent, an upward revision of 0.4 percentage point. Private services-producing industries increased 3.7 percent, an upward revision of 0.4 percentage point. Private goods-producing industries decreased 0.6 percent, an upward revision of 0.1 percentage point. Government increased 1.1 percent, an upward revision of 1.1 percentage points (table 16). * * * Next release, October 27, 2022, at 8:30 a.m. EDT 1 Revision in change is calculated as the difference between the updated level changes and the previously published level changes.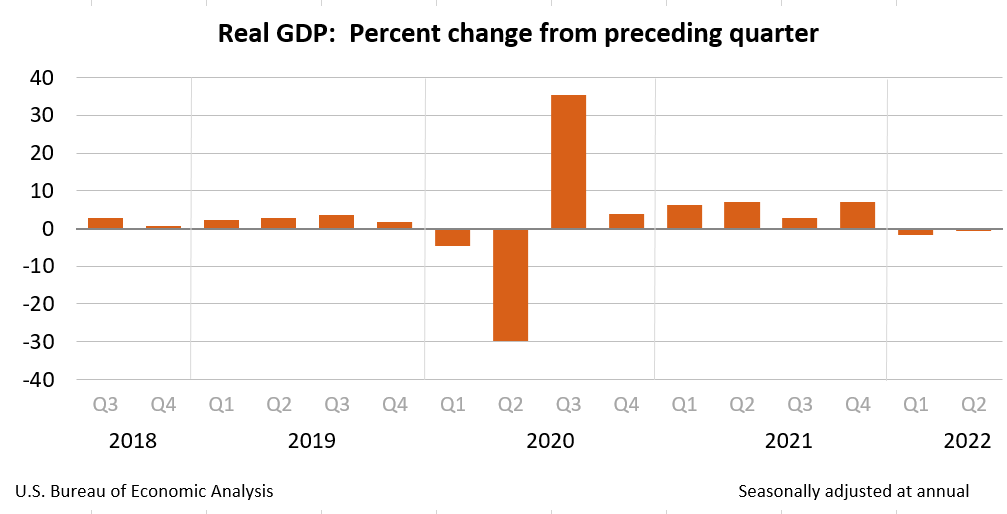
Advance Estimate
Second Estimate
Third Estimate
(Percent change from preceding quarter)
Real GDP
-0.9
-0.6
-0.6
Current-dollar GDP
7.8
8.4
8.5
Real GDI
…
1.4
0.1
Average of Real GDP and Real GDI
…
0.4
-0.3
Gross domestic purchases price index
8.2
8.4
8.5
PCE price index
7.1
7.1
7.3
PCE price index excluding food and energy
4.4
4.4
4.7
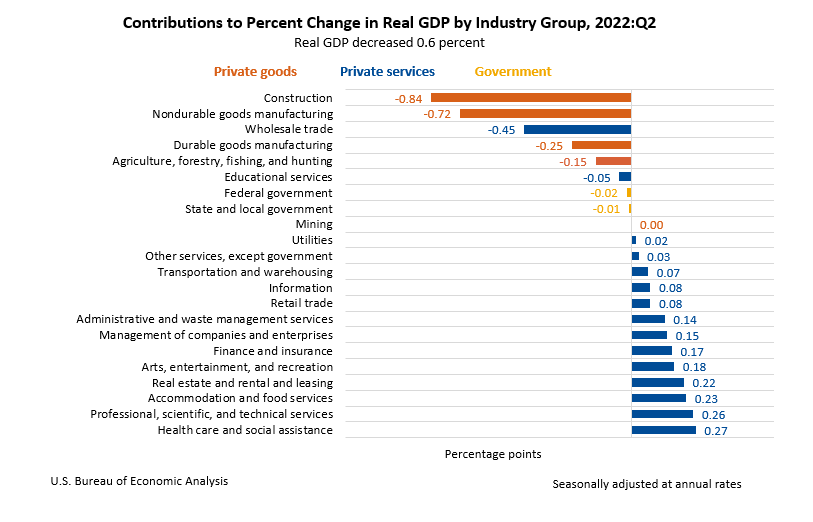
Today’s release includes estimates of GDP by industry, or value added—a measure of an industry’s contribution to GDP. Private goods-producing industries decreased 10.4 percent in the second quarter, private services-producing industries increased 2.0 percent, and government decreased 0.2 percent (table 12). Overall, 9 of 22 industry groups contributed to the second-quarter decline in real GDP.
Within private services-producing industries, the leading contributors to the increase were health care and social assistance (led by hospitals); professional, scientific, and technical services; real estate and rental and leasing; and accommodation and food services. Partly offsetting these increases was a decrease in wholesale trade.
The decrease in government reflected decreases in both federal as well as state and local governments.
Real gross output—principally a measure of an industry’s sales or receipts, which includes sales to final users in the economy (GDP) and sales to other industries (intermediate inputs)—increased 1.7 percent in the second quarter. This reflected an increase of 3.6 percent for private services-producing industries, a decrease of 3.0 percent for private goods-producing industries, and an increase of 0.8 percent for government (table 16). Overall, 16 of 22 industry groups contributed to the increase in real gross output.
First Quarter 2022
Previous Estimate
Revised
(Percent change from preceding quarter)
Real GDP
-1.6
-1.6
Current-dollar GDP
6.6
6.6
Real GDI
1.8
0.8
Average of Real GDP and Real GDI
0.1
-0.4
Gross domestic purchases price index
8.0
8.1
PCE price index
7.1
7.5
PCE price index excluding food and energy
5.2
5.6
Gross Domestic Product, Third Quarter 2022 (Advance Estimate)
* All content is copyrighted by Industry Intelligence, or the original respective author or source. You may not recirculate, redistrubte or publish the analysis and presentation included in the service without Industry Intelligence's prior written consent. Please review our terms of use.


