WASHINGTON
,
October 3, 2023
(press release)
–
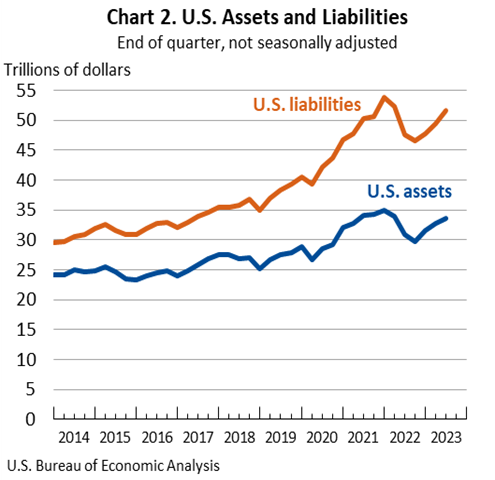
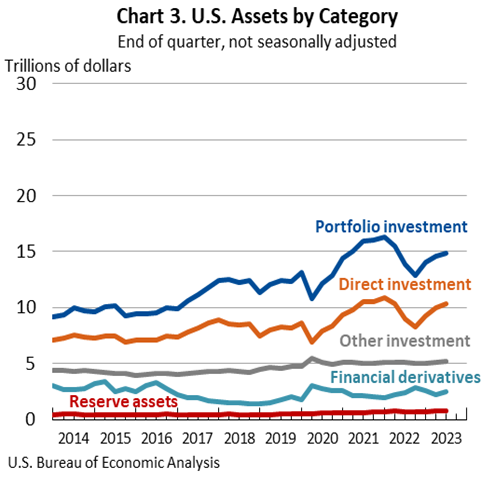
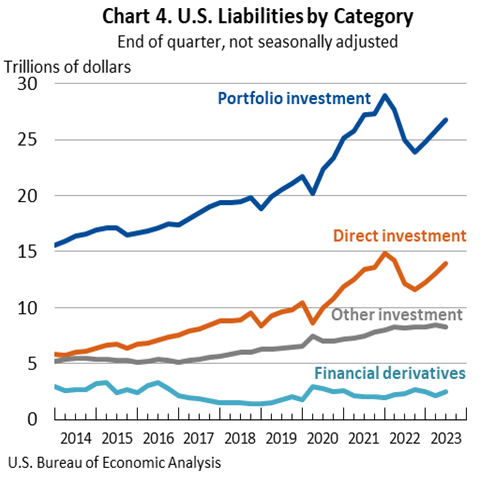
The U.S. net international investment position, the difference between U.S. residents' foreign financial assets and liabilities, was –$18.00 trillion at the end of the second quarter of 2023, according to statistics released today by the U.S. Bureau of Economic Analysis (BEA). Assets totaled $33.58 trillion, and liabilities were $51.58 trillion. At the end of the first quarter, the net investment position was –$16.74 trillion (revised). The net investment position and components of assets and liabilities are presented in table 1. The –$1.26 trillion change in the net investment position from the first quarter to the second quarter came from net financial transactions of –$105.0 billion and net other changes in position, such as price and exchange-rate changes, of –$1.16 trillion. Net other changes mostly reflected U.S. stock price increases that exceeded foreign stock price increases (table A). Table A. Quarterly Change in the U.S. Net International Investment Position 1. Disaggregation of other changes in position into price changes, exchange-rate changes, and other changes in volume and valuation is presented for annual statistics released in March and revised in June each year. 2. Financial transactions and other changes in financial derivatives positions are available on a net basis; they are not separately available for U.S. assets and U.S. liabilities. U.S. Bureau of Economic Analysis U.S. assets increased by $866.6 billion to a total of $33.58 trillion at the end of the second quarter. All major categories of assets increased, except for U.S. reserve assets. Direct investment assets increased by $298.5 billion to $10.30 trillion and portfolio investment assets increased by $197.3 billion to $14.83 trillion, driven mainly by foreign stock price increases that raised the market value of these assets. Financial derivatives increased by $289.7 billion to $2.48 trillion, driven by increases in single-currency interest rate contracts. Other investment assets increased by $101.6 billion to $5.23 trillion, driven by U.S. acquisitions of loans. These increases in assets were partly offset by a decrease in U.S. reserve assets that mostly reflected gold price decreases. U.S. liabilities increased by $2.13 trillion to a total of $51.58 trillion at the end of the second quarter. All major categories of liabilities increased, except for other investment liabilities. Portfolio investment liabilities increased by $994.1 billion to $26.81 trillion and direct investment liabilities increased by $980.4 billion to $14.00 trillion, driven mainly by U.S. stock price increases that raised the market value of these liabilities. Financial derivatives increased by $304.5 billion to $2.46 trillion, driven by increases in single-currency interest rate contracts. These increases in liabilities were partly offset by a decrease in other investment liabilities that mostly reflected U.S. repayments of loans. Table B. Updates to First-Quarter 2023 International Investment Position Aggregates U.S. Bureau of Economic Analysis Newly Available Source Data on Portfolio Investment With this release of the U.S. International Investment Position Accounts, BEA has incorporated newly available source data from the Treasury International Capital System "Aggregate Holdings, Purchases and Sales, and Fair Value Changes of Long-Term Securities by U.S. and Foreign Residents" (TIC SLT) form to more accurately measure portfolio investment transactions in equity and investment fund shares and in long-term debt securities. The new TIC SLT transactions data, beginning with the first quarter of 2023, have replaced BEA's estimation method for these portfolio investment transactions statistics that were derived from positions data reported on the TIC SLT form. For more information on this method, which remains relevant for periods prior to 2023, see paragraph 17.15 of U.S. International Economic Accounts: Concepts and Methods. For more information on the new source data, see the "Technical Note" included with the "U.S. International Transactions" news release on September 21. Portfolio investment position statistics presented in this release are not affected by the new treatment of transactions. Next release: December 28, 2023, at 8:30 a.m. EST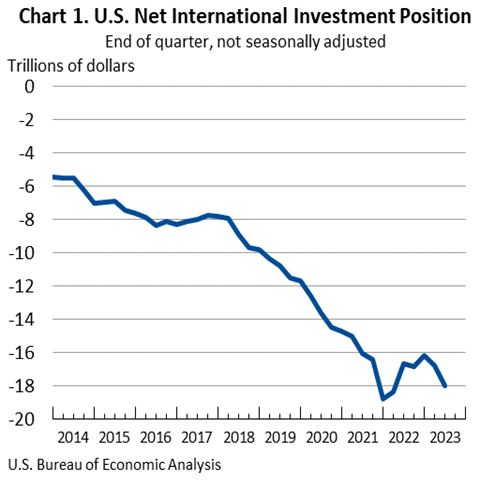
[Billions of dollars, not seasonally adjusted]
End of quarter position,
2023:Q1Change in position in 2023:Q2
End of quarter position,
2023:Q2
Total
Attributable to:
Financial
transactionsOther changes
in position 1
U.S. net international investment position
–16,736.0
–1,261.7
–105.0
–1,156.6
–17,997.7
Net position excluding financial derivatives
–16,778.4
–1,246.9
–100.3
–1,146.6
–18,025.3
Financial derivatives other than reserves, net
42.4
–14.7
–4.7
–10.0
27.7
U.S. assets
32,711.6
866.6
(2)
(2)
33,578.2
Assets excluding financial derivatives
30,518.5
576.9
245.9
331.0
31,095.3
Financial derivatives other than reserves
2,193.1
289.7
(2)
(2)
2,482.8
U.S. liabilities
49,447.6
2,128.3
(2)
(2)
51,575.9
Liabilities excluding financial derivatives
47,296.9
1,823.8
346.2
1,477.6
49,120.7
Financial derivatives other than reserves
2,150.7
304.5
(2)
(2)
2,455.2
[Trillions of dollars, not seasonally adjusted]
Preliminary estimates
Revised estimates
U.S. net international investment position
–16.75
–16.74
U.S. assets
32.74
32.71
U.S. liabilities
49.49
49.45
U.S. International Investment Position, 3rd Quarter 2023
* All content is copyrighted by Industry Intelligence, or the original respective author or source. You may not recirculate, redistrubte or publish the analysis and presentation included in the service without Industry Intelligence's prior written consent. Please review our terms of use.


