WASHINGTON
,
September 28, 2022
(press release)
–
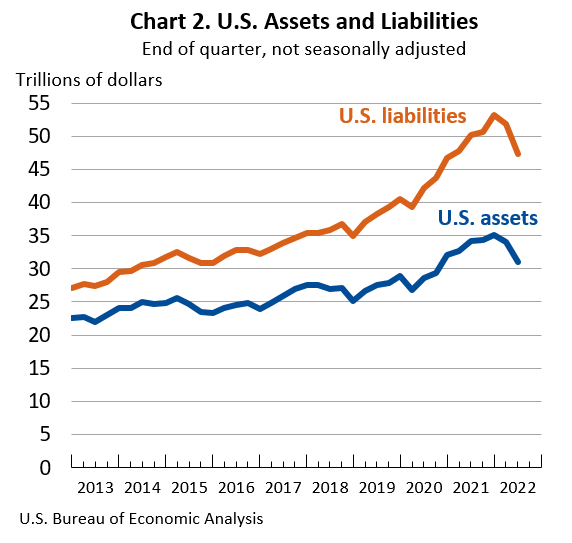
The U.S. net international investment position (IIP), the difference between U.S. residents’ foreign financial assets and liabilities, was –$16.31 trillion at the end of the second quarter of 2022, according to statistics released today by the U.S. Bureau of Economic Analysis (BEA). Assets totaled $30.98 trillion, and liabilities were $47.29 trillion. At the end of the first quarter, the net investment position was –$17.75 trillion. The net investment positions and components of assets and liabilities are presented in table 1. The $1.44 trillion change in the net investment position from the first quarter to the second quarter came from net financial transactions of –$139.1 billion and net other changes in position, such as price and exchange-rate changes, of $1.58 trillion. Net other changes mostly reflected U.S. stock price decreases that exceeded foreign stock price decreases, which lowered the value of U.S. liabilities more than U.S. assets (table A). Table A. Quarterly Change in the U.S. Net International Investment Position 1. Disaggregation of other changes in position into price changes, exchange-rate changes, and other changes in volume and valuation is presented for annual statistics released in March and revised in June each year. 2. Financial transactions and other changes in financial derivatives positions are available on a net basis; they are not separately available for U.S. assets and U.S. liabilities. U.S. Bureau of Economic Analysis U.S. assets decreased by $3.06 trillion to a total of $30.98 trillion at the end of the second quarter, reflecting decreases in portfolio investment and direct investment assets that were driven mainly by foreign stock price decreases, and by depreciation of major currencies against the U.S. dollar that lowered the value of these assets in dollar terms. Portfolio investment assets decreased by $1.72 trillion to $13.77 trillion, and direct investment assets decreased by $1.39 trillion to $9.04 trillion. U.S. liabilities decreased by $4.50 trillion to a total of $47.29 trillion at the end of the second quarter, reflecting decreases in portfolio investment and direct investment liabilities that were driven mainly by U.S. stock price decreases. Portfolio investment liabilities decreased by $2.53 trillion to $24.68 trillion, and direct investment liabilities decreased by $2.07 trillion to $12.08 trillion. U.S. Bureau of Economic Analysis Next release: December 29, 2022, at 8:30 a.m. EST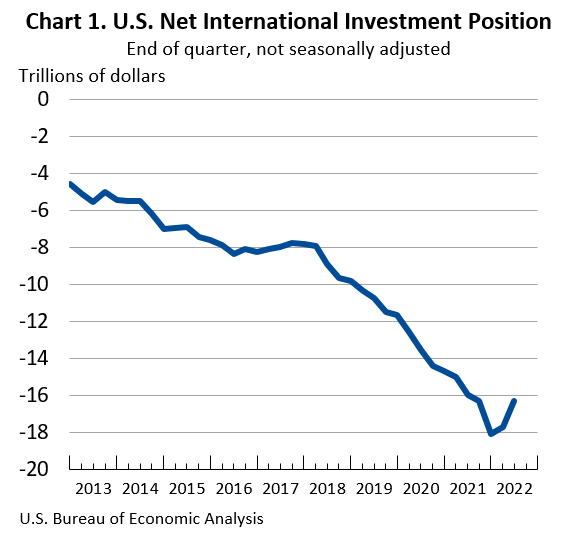
[Billions of dollars, not seasonally adjusted]
End of quarter position,
2022:Q1Change in position in 2022:Q2
End of quarter position,
2022:Q2
Total
Attributable to:
Financial
transactionsOther changes
in position 1
U.S. net international investment position
–17,745.6
1,436.3
–139.1
1,575.4
–16,309.3
Net position excluding financial derivatives
–17,808.0
1,427.3
–93.2
1,520.5
–16,380.7
Financial derivatives other than reserves, net
62.4
9.0
–45.9
54.9
71.4
U.S. assets
34,038.6
–3,061.7
(2)
(2)
30,976.9
Assets excluding financial derivatives
31,780.1
–3,208.9
409.1
–3,618.0
28,571.2
Financial derivatives other than reserves
2,258.5
147.1
(2)
(2)
2,405.7
U.S. liabilities
51,784.2
–4,498.0
(2)
(2)
47,286.2
Liabilities excluding financial derivatives
49,588.0
–4,636.1
502.3
–5,138.5
44,951.9
Financial derivatives other than reserves
2,196.1
138.1
(2)
(2)
2,334.2
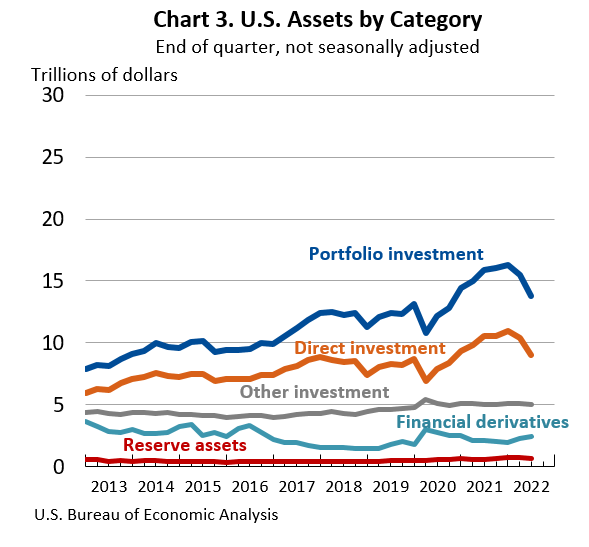
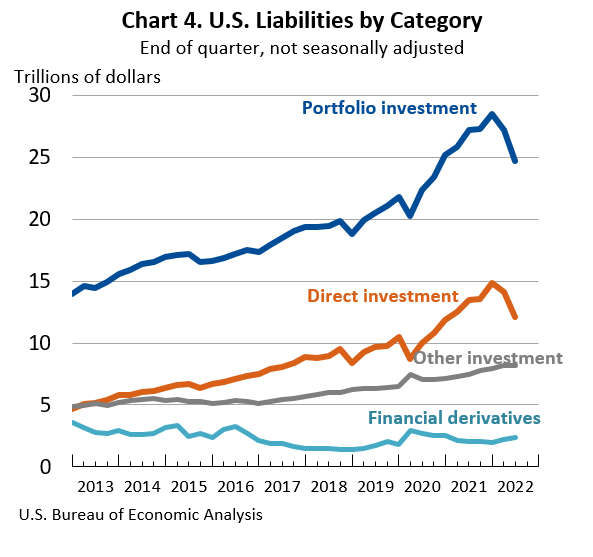
Table B. Updates to First-Quarter 2022 International Investment Position Aggregates
[Trillions of dollars, not seasonally adjusted]
Preliminary estimates
Revised estimates
U.S. net international investment position
–17.75
–17.75
U.S. assets
34.00
34.04
U.S. liabilities
51.75
51.78
U.S. International Investment Position, 3rd Quarter 2022
* All content is copyrighted by Industry Intelligence, or the original respective author or source. You may not recirculate, redistrubte or publish the analysis and presentation included in the service without Industry Intelligence's prior written consent. Please review our terms of use.


