WASHINGTON
,
December 8, 2023
(press release)
–
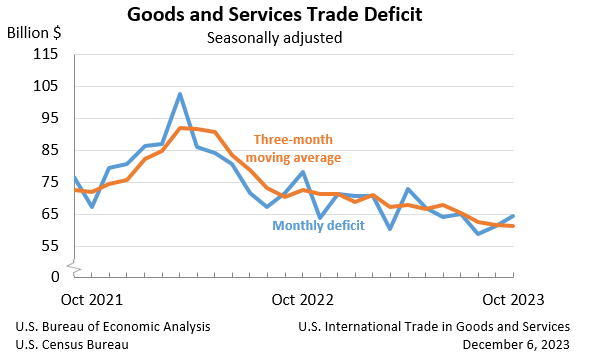
The U.S. Census Bureau and the U.S. Bureau of Economic Analysis announced today that the goods and services deficit was $64.3 billion in October, up $3.1 billion from $61.2 billion in September, revised. $64.3 Billion +5.1%° $258.8 Billion –1.0%° $323.0 Billion +0.2%° Next release: Tuesday, January 9, 2024 (°) Statistical significance is not applicable or not measurable. Data adjusted for seasonality but not price changes Source: U.S. Census Bureau, U.S. Bureau of Economic Analysis; U.S. International Trade in Goods and Services, December 6, 2023 Exports, Imports, and Balance (exhibit 1) October exports were $258.8 billion, $2.6 billion less than September exports. October imports were $323.0 billion, $0.5 billion more than September imports. The October increase in the goods and services deficit reflected an increase in the goods deficit of $3.5 billion to $89.8 billion and an increase in the services surplus of $0.4 billion to $25.5 billion. Year-to-date, the goods and services deficit decreased $161.4 billion, or 19.8 percent, from the same period in 2022. Exports increased $28.0 billion or 1.1 percent. Imports decreased $133.4 billion or 4.0 percent. Three-Month Moving Averages (exhibit 2) The average goods and services deficit decreased $0.2 billion to $61.3 billion for the three months ending in October. Year-over-year, the average goods and services deficit decreased $11.1 billion from the three months ending in October 2022. Exports (exhibits 3, 6, and 7) Exports of goods decreased $3.2 billion to $173.5 billion in October. Exports of goods on a Census basis decreased $2.5 billion. Net balance of payments adjustments decreased $0.7 billion. Exports of services increased $0.6 billion to $85.3 billion in October. Imports (exhibits 4, 6, and 8) Imports of goods increased $0.3 billion to $263.3 billion in October. Imports of goods on a Census basis increased $0.2 billion. Net balance of payments adjustments increased less than $0.1 billion. Imports of services increased $0.2 billion to $59.8 billion in October. Real Goods in 2017 Dollars – Census Basis (exhibit 11) The real goods deficit increased $0.7 billion, or 0.9 percent, to $87.0 billion in October, compared to a 3.2 percent increase in the nominal deficit. Revisions Exports and imports of goods and services were revised for April through September 2023 to incorporate more comprehensive and updated quarterly and monthly data. Revisions to September exports Revisions to September imports Goods by Selected Countries and Areas: Monthly – Census Basis (exhibit 19) The October figures show surpluses, in billions of dollars, with Netherlands ($3.8), South and Central America ($3.7), Hong Kong ($1.9), Australia ($1.3), Belgium ($0.8), Brazil ($0.4), Singapore ($0.2), and United Kingdom ($0.2). Deficits were recorded, in billions of dollars, with China ($23.9), European Union ($19.2), Mexico ($11.9), Vietnam ($9.3), Germany ($7.5), Canada ($7.3), Japan ($6.6), Ireland ($5.8), Taiwan ($5.1), Italy ($4.0), South Korea ($3.7), India ($3.4), Malaysia ($2.0), France ($0.9), Israel ($0.6), Switzerland ($0.3), and Saudi Arabia ($0.2). Goods and Services by Selected Countries and Areas: Quarterly – Balance of Payments Basis (exhibit 20) Statistics on trade in goods and services by country and area are only available quarterly, with a one-month lag. With this release, third-quarter figures are now available. The third-quarter figures show surpluses, in billions of dollars, with South and Central America ($21.8), Netherlands ($14.6), Australia ($8.3), Singapore ($6.8), Hong Kong ($6.6), Brazil ($4.8), Belgium ($3.3), United Kingdom ($3.1), Saudi Arabia ($2.0), and Switzerland ($1.6). Deficits were recorded, in billions of dollars, with China ($63.8), Mexico ($39.1), European Union ($26.5), Vietnam ($26.2), Germany ($20.5), Japan ($14.9), Taiwan ($12.8), South Korea ($11.5), India ($11.5), Italy ($10.9), Canada ($10.0), Malaysia ($5.5), France ($4.2), Ireland ($4.1), and Israel ($2.2). All statistics referenced are seasonally adjusted; statistics are on a balance of payments basis unless otherwise specified. Additional statistics, including not seasonally adjusted statistics and details for goods on a Census basis, are available in exhibits 1-20b of this release. For information on data sources, definitions, and revision procedures, see the explanatory notes in this release. The full release can be found at www.census.gov/foreign-trade/Press-Release/current_press_release/index.html or www.bea.gov/data/intl-trade-investment/international-trade-goods-and-services. The full schedule is available in the Census Bureau’s Economic Briefing Room at www.census.gov/economic-indicators/ or on BEA’s website at www.bea.gov/news/schedule. Next release: January 9, 2024, at 8:30 a.m. EST U.S. International Trade in Goods and Services Release Dates in 2024
Deficit:
Exports:
Imports:
U.S. International Trade in Goods and Services, November 2023
Statistical Month
Date
November 2023
January 9
December 2023
February 7
January 2024
March 7
February 2024
April 4
March 2024
May 2
April 2024
June 6
May 2024
July 3
June 2024
August 6
July 2024
September 4
August 2024
October 8
September 2024
November 5
October 2024
December 5
* All content is copyrighted by Industry Intelligence, or the original respective author or source. You may not recirculate, redistrubte or publish the analysis and presentation included in the service without Industry Intelligence's prior written consent. Please review our terms of use.


