WASHINGTON
,
May 22, 2023
(press release)
–
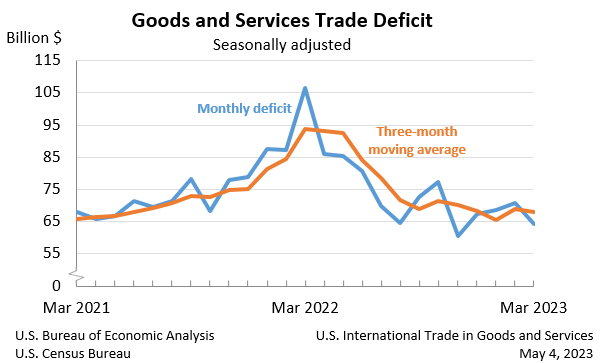
The U.S. Census Bureau and the U.S. Bureau of Economic Analysis announced today that the goods and services deficit was $64.2 billion in March, down $6.4 billion from $70.6 billion in February, revised. Next release: Wednesday, June 7, 2023 (°) Statistical significance is not applicable or not measurable. Data adjusted for seasonality but not price changes Source: U.S. Census Bureau, U.S. Bureau of Economic Analysis; U.S. International Trade in Goods and Services, May 4, 2023 Exports, Imports, and Balance (exhibit 1) March exports were $256.2 billion, $5.3 billion more than February exports. March imports were $320.4 billion, $1.1 billion less than February imports. The March decrease in the goods and services deficit reflected a decrease in the goods deficit of $6.4 billion to $86.6 billion and a decrease in the services surplus of less than $0.1 billion to $22.4 billion. Year-to-date, the goods and services deficit decreased $77.6 billion, or 27.6 percent, from the same period in 2022. Exports increased $61.4 billion or 8.7 percent. Imports decreased $16.2 billion or 1.6 percent. Three-Month Moving Averages (exhibit 2) The average goods and services deficit decreased $1.0 billion to $67.8 billion for the three months ending in March. Year-over-year, the average goods and services deficit decreased $25.9 billion from the three months ending in March 2022. Exports (exhibits 3, 6, and 7) Exports of goods increased $5.2 billion to $174.3 billion in March. Exports of goods on a Census basis increased $5.0 billion. Net balance of payments adjustments increased $0.2 billion. Exports of services increased $0.1 billion to $81.8 billion in March. Imports (exhibits 4, 6, and 8) Imports of goods decreased $1.2 billion to $260.9 billion in March. Imports of goods on a Census basis decreased $1.4 billion. Net balance of payments adjustments increased $0.2 billion. Imports of services increased $0.1 billion to $59.5 billion in March. Real Goods in 2012 Dollars – Census Basis (exhibit 11) The real goods deficit decreased $4.6 billion, or 4.4 percent, to $99.4 billion in March, compared to a 7.0 percent decrease in the nominal deficit. Revisions Revisions to February exports Revisions to February imports Goods by Selected Countries and Areas: Monthly – Census Basis (exhibit 19) The March figures show surpluses, in billions of dollars, with South and Central America ($5.7), Netherlands ($4.0), Belgium ($2.1), Australia ($1.7), Hong Kong ($1.6), United Kingdom ($1.2), and Brazil ($1.1). Deficits were recorded, in billions of dollars, with China ($22.9), European Union ($15.6), Mexico ($11.6), Canada ($7.7), Vietnam ($7.5), Germany ($6.3), Japan ($5.9), Ireland ($5.7), Italy ($4.0), South Korea ($3.6), Taiwan ($3.6), India ($3.1), Malaysia ($2.8), Switzerland ($2.1), France ($0.9), Israel ($0.5), Saudi Arabia ($0.4), and Singapore ($0.2). All statistics referenced are seasonally adjusted; statistics are on a balance of payments basis unless otherwise specified. Additional statistics, including not seasonally adjusted statistics and details for goods on a Census basis, are available in exhibits 1-20b of this release. For information on data sources, definitions, and revision procedures, see the explanatory notes in this release. The full release can be found at www.census.gov/foreign-trade/Press-Release/current_press_release/index.html or www.bea.gov/data/intl-trade-investment/international-trade-goods-and-services. The full schedule is available in the Census Bureau’s Economic Briefing Room at www.census.gov/economic-indicators/ or on BEA’s website at www.bea.gov/news/schedule. Next release: June 7, 2023, at 8:30 a.m. EDT Notice With the releases of the “U.S. International Trade in Goods and Services” report (FT-900) and the FT-900 Annual Revision on June 7, 2023, statistics on trade in goods on both a Census basis and a balance of payments (BOP) basis will be revised beginning with 2018 and statistics on trade in services will be revised beginning with 2017. The revised statistics for goods on a BOP basis and for services will also be included in the “U.S. International Transactions, First Quarter 2023 and Annual Update” report and in the international transactions interactive database, both to be released by BEA on June 22, 2023. Revised statistics on trade in goods will reflect: Revised statistics on trade in services will reflect: For more information, see “Preview of the 2023 Annual Update of the International Economic Accounts” in the Survey of Current Business. Upcoming Change to the Real (Chained-Dollar) Series With the releases of the FT-900 and the FT-900 Annual Revision on June 7, 2023, the reference year for the chained-dollar series will be updated to 2017 from 2012 to reference the time series on prices from a more recent year. The historical chained-dollar series, which begin in 1994, will also be revised to reflect the new reference year. See the “Adjustments for price change” section in the explanatory notes for more information. If you have questions or need additional information, please contact the Census Bureau, Economic Indicators Division, International Trade Macro Analysis Branch, on (800) 549-0595, option 4, or at eid.international.trade.data@census.gov or BEA, Balance of Payments Division, at InternationalAccounts@bea.gov.
Deficit:
$64.2 Billion
–9.1%°
Exports:
$256.2 Billion
+2.1%°
Imports:
$320.4 Billion
–0.3%°
U.S. International Trade in Goods and Services, April 2023
Upcoming Updates to Goods and Services
* All content is copyrighted by Industry Intelligence, or the original respective author or source. You may not recirculate, redistrubte or publish the analysis and presentation included in the service without Industry Intelligence's prior written consent. Please review our terms of use.


