SEATTLE
,
August 30, 2022
(press release)
–
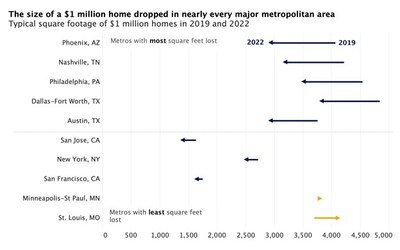
Market share of $1 million-plus homes more than doubled during the pandemic Sales of homes costing $1 million more than doubled over the past three years, but as with many products in the grocery store, buyers are getting less than they used to, according to a new analysis by Zillow®. Million-dollar homes are getting smaller. Homes that sold at or near $1 million contracted nearly 500 square feet, from a peak of 3,021 in the middle of 2020 to a valley of 2,530 in early 2022, according to floor plan data for Zillow listings. Home size bounced back before July and is now 2,624 square feet, down 397 square feet from the 2020 peak. "Buyers with seven-figure budgets shopping for homes during the pandemic were doing so coming off the longest period of economic growth in U.S. history and with the help of historically low interest rates," said Anushna Prakash, economic data analyst at Zillow. "Sales for expensive homes soared while buyers in the heat of competition accepted smaller layouts." The typical home in the $1 million range shrank in nearly every major metropolitan area. The largest declines are found in Phoenix — down 1,116 square feet from 2019 to 2022 — and Nashville, where these homes lost 1,019 square feet. Floor plans grew in just two major metros: by a closet in Minneapolis (36 square feet), and by at least a room and a half in St. Louis (406). Overall home sales were elevated during the pandemic, but have slowed in recent months as affordability challenges have pushed many buyers to the sidelines. The recent move of the market toward rebalancing has shifted competition away from mid- and high-tier properties, and back to the most affordable homes. Sales for homes priced at $1 million or more rose from 43,421 in the second quarter of 2019 to 90,110 in 2022, a new record volume. These once-rare digs also constitute a much greater portion of the total market. As home values skyrocketed across the country, the share of single-family homes that sold for $1 million or more has more than doubled, moving from 2.7% in 2019 to 2.5% in 2020 to 6.4% now. Portland led major metros in sales volume increase: The number of $1 million-plus sales soared by 253% since mid-2019. Austin, where home values are up 71% since mid-2019, saw sales jump by 220%. The only metro that witnessed a decline in the volume of transactions with a $1 million-plus price tag was Boston, where the share fell by 32%. Boston and other major East Coast metros had relatively low appreciation over the past three years compared to other regions. Portland, Austin and Riverside are where sales of $1 million-plus homes have risen the most since 2019. Sales rose the least in San Jose and San Francisco, and fell in Boston. One million dollars in San Jose will buy just three bedrooms, two bathrooms and just shy of 1,400 square feet of living space — about $715 per square foot, the highest amount among major metros. For context, a typical single-family home in San Jose was valued at over $1.5 million in July. Far from an exclusive membership, homes costing $1 million or more are the norm in the San Jose area, comprising 72% of the country's most expensive market. Those looking for the most bang for their million bucks should head to Hartford, Connecticut, then to the Midwest. Among the 50 major metros included in the study, Hartford has the lowest price per square foot at $205, followed closely by Indianapolis, Oklahoma City, Kansas City and Cincinnati. Though options in that range are limited in these areas, it's hard to deny the opulence afforded by the expense, with square footage upward of 4,500. Metropolitan Median Price Per Share of Median $1 Million Median Median Bathrooms – United States 2,624 $381 6.4 % 31 4 3 New York, NY 2,500 $400 9.4 % 60 4 3 Los Angeles–Long Beach–Anaheim, CA 1,644 $608 39.6 % 59 3 2 Chicago, IL 3,375 $296 3.8 % 27 4 3.5 Dallas–Fort Worth, TX 3,818 $262 5.1 % 16 4 4 Philadelphia, PA 3,510 $285 2.7 % 26 4 3.5 Houston, TX 3,831 $261 3.7 % 18 4 3.5 Washington, DC 2,572 $389 12.6 % 35 4 3.5 Miami–Fort Lauderdale, FL 2,617 $382 8.4 % 33 4 3 Atlanta, GA 4,130 $242 3.5 % 24 5 4.5 Boston, MA 2,745 $364 9.3 % 39 4 2.5 San Francisco, CA 1,636 $611 62.0 % 54 3 2 Detroit, MI 3,700 $270 1.2 % 25 4 4 Riverside, CA 2,820 $355 7.6 % 23 4 3 Phoenix, AZ 2,933 $341 6.9 % 23 4 3 Seattle, WA 2,160 $463 27.1 % 36 3 2 Minneapolis–St. Paul, MN 3,797 $263 3.4 % 25.5 4 2.5 San Diego, CA 1,835 $545 32.1 % 43 3 2.5 St. Louis, MO 4,108 $243 1.5 % 50 4 3.5 Tampa, FL 2,690 $372 3.6 % 30.5 4 3 Baltimore, MD 3,550 $282 2.8 % 23 4 4 Denver, CO 3,083 $324 11.7 % 28 4 2.5 Portland, OR 2,886 $347 8.3 % 27 4 3 Charlotte, NC 3,790 $264 4.3 % 19 4 3.5 Sacramento, CA 2,641 $379 9.9 % 27 4 3 San Antonio, TX 3,830 $261 2.2 % 16.5 4 3.5 Orlando, FL 3,671 $272 3.5 % 17 5 4 Cincinnati, OH 4,514 $222 1.1 % 27 4 4.5 Kansas City, MO 4,529 $221 2.0 % 16 5 4.5 Las Vegas, NV 3,339 $299 3.8 % 19 4 3 Columbus, OH 3,467 $288 1.2 % 22 4 4 Indianapolis, IN 4,788 $209 1.2 % 18 5 4.5 San Jose, CA 1,399 $715 71.6 % 49 3 2 Austin, TX 2,930 $341 11.2 % 16 4 3 Virginia Beach, VA 3,500 $286 1.6 % 21 4 4 Nashville, TN 3,181 $314 9.0 % 17 4 3.5 Providence, RI 2,944 $340 5.0 % 62 4 2.5 Jacksonville, FL 2,898 $345 3.4 % 19 4 3.5 Oklahoma City, OK 4,677 $214 1.3 % 17.5 4.5 4.5 Hartford, CT 4,873 $205 1.6 % 23 4 4.25 Richmond, VA 2,967 $337 2.7 % 37 4 3 Raleigh, NC 3,772 $265 4.6 % 15 4 4 Salt Lake City, UT 3,561 $281 5.9 % 37 5 2.5 *Table ordered by market size Methodology Additionally, metropolitan areas that had fewer than 30 sales of $1 million homes in a quarter are excluded from the analysis, due to limited observations from which to draw trends. About Zillow Group Zillow Group's affiliates and subsidiaries include Zillow®, Zillow Premier Agent®, Zillow Home Loans™, Zillow Closing Services™, Trulia®, Out East®, ShowingTime®, Bridge Interactive®, dotloop®, StreetEasy® and HotPads®. Zillow Home Loans, LLC is an Equal Housing Lender, NMLS #10287 (www.nmlsconsumeraccess.org). SOURCE Zillow
Area*
Square
Feet – $1
Million
Home
Square
Foot
$1 Million-
Plus Sales
Age in
Years –
Home
Number of
Bedrooms – $1
Million Home
Number of
$1 Million
Home
One million-dollar homes are defined as single-family homes that sold for between $950,000 and $1,050,000. Condominiums are excluded to better control for composition of homes across markets. One million-dollar-plus homes are defined as single-family homes that sold for $1,000,000 or more.
Zillow Group, Inc. (NASDAQ: Z and ZG) is reimagining real estate to make it easier to unlock life's next chapter. As the most visited real estate website in the United States, Zillow® and its affiliates offer customers an on-demand experience for selling, buying, renting or financing with transparency and ease.
For further information: Mark Stayton, Zillow, press@zillow.com
* All content is copyrighted by Industry Intelligence, or the original respective author or source. You may not recirculate, redistrubte or publish the analysis and presentation included in the service without Industry Intelligence's prior written consent. Please review our terms of use.


