December 5, 2023
(press release)
–
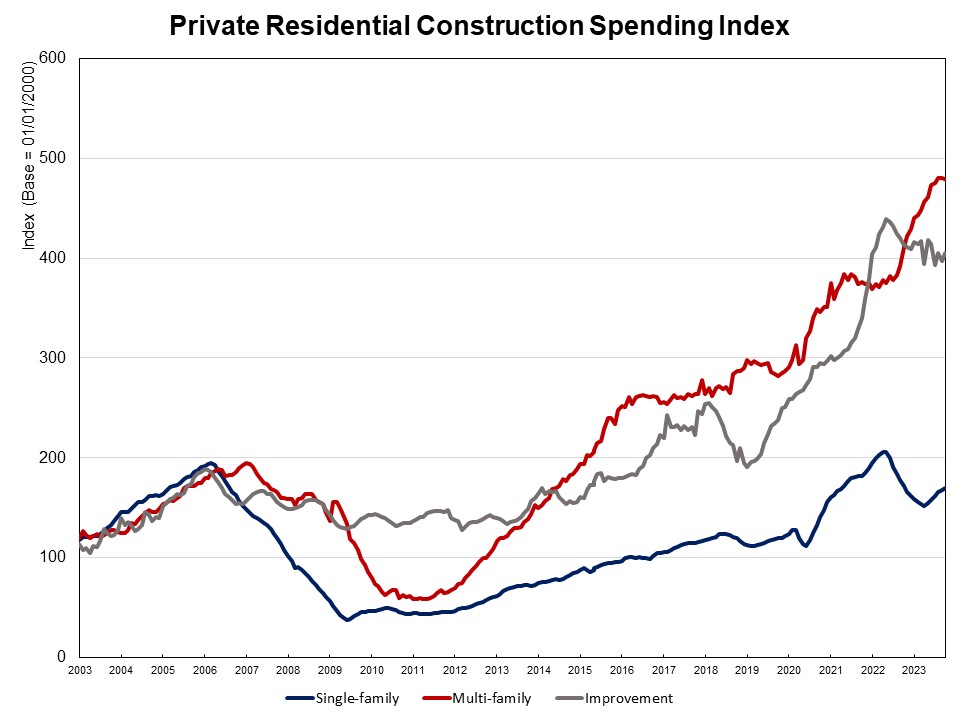
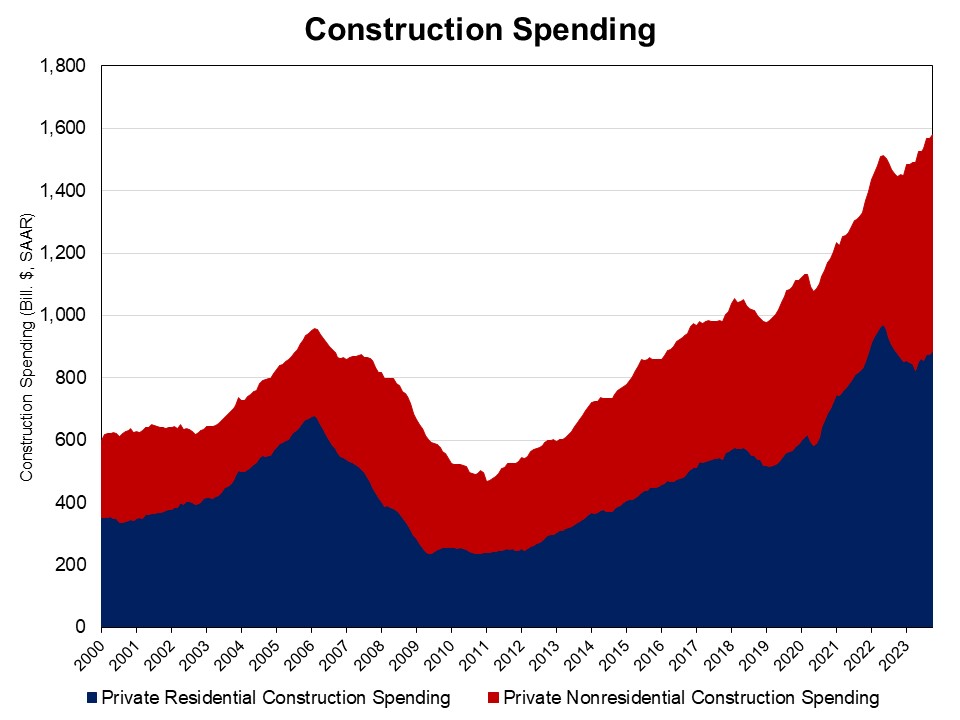
NAHB analysis of Census Construction Spending data shows that private residential construction spending rose 1.2% in October, after a dip in September. It stood at a seasonally adjusted annual pace of $884 billion. Total private residential construction spending is 0.7% higher compared to a year ago. This was the first year-over-year increase since December 2022. The total construction monthly increase is attributed to more spending on single-family construction and improvements. Spending on single-family construction rose 1.1% in October. It was the sixth consecutive monthly increase since April 2023. Compared to a year ago, spending on single-family construction was 1.4% lower. Multifamily construction spending dipped 0.2% in October, as a large stock of multifamily housing is under construction and rental vacancy rate rose to 6.6% in the third quarter from a record low of 5.6%. Private residential improvement spending increased 2% in October but was 2% lower compared to a year ago. Keep in mind that construction spending reports the value of property put-in-place. Per the Census definition: The “value of construction put in place” is a measure of the value of construction installed or erected at the site during a given period. The total value-in-place for a given period is the sum of the value of work done on all projects underway during this period, regardless of when work on each individual project was started or when payment was made to the contractors. For some categories, published estimates represent payments made during a period rather than the value of work done during that period. The NAHB construction spending index, which is shown in the graph below (the base is January 2000), illustrates how construction spending on single-family has slowed since early 2022 under the pressure of supply-chain issues and elevated interest rates. Multifamily construction spending has had solid growth in recent months, while improvement spending has slowed since mid-2022. Before the COVID-19 crisis hit the U.S. economy, single-family and multifamily construction spending experienced solid growth from the second half of 2019 to February 2020, followed by a quick post-covid rebound since July 2020. Spending on private nonresidential construction was up 22.4% over a year ago. The annual private nonresidential spending increase was mainly due to higher spending on the class of manufacturing category ($86 billion), followed by the power category ($11 billion).


* All content is copyrighted by Industry Intelligence, or the original respective author or source. You may not recirculate, redistrubte or publish the analysis and presentation included in the service without Industry Intelligence's prior written consent. Please review our terms of use.


