OTTAWA
,
March 24, 2022
(press release)
–
Approximately 633,000 Canadians received regular Employment Insurance (EI) benefits in January, little changed from one month earlier. January EI statistics reflect labour market conditions during the week of January 9 to 15, 2022. With the spread of the Omicron variant of COVID-19, many jurisdictions had implemented stricter public health measures. Capacity limits or closures had been reintroduced in retail stores and high-contact settings such as restaurants, bars, concert halls and gyms. The number of Canadians collecting regular EI benefits holds steady in January According to the Labour Force Survey (LFS), unemployment rose by 106,000 to 1.3 million in January. The unemployed included 1.1 million Canadians who were looking for work and 200,000 who had a connection to a job, either because they were on temporary layoff or had arrangements to begin a new job in the near future. Chart 1: Regular Employment Insurance (EI) beneficiaries holds steady in January A higher proportion of the labour force in Atlantic Canada receives regular EI benefits Atlantic Canada had the largest share of its labour force receiving regular EI benefits, led by Newfoundland and Labrador (15.2%) and Prince Edward Island (10.1%). Outside of Atlantic Canada, Quebec (3.6%) had the highest proportion of regular EI beneficiaries relative to the labour force, while British Columbia had the lowest (2.0%). On a regional basis, the census metropolitan areas (CMAs) of Regina (-13.2%; -400) and Oshawa (-12.6%; -700) posted the largest percentage decreases in regular EI beneficiaries. In Ontario, the Windsor CMA saw its number of regular EI beneficiaries increase by 80.3% (+4,000). According to the January LFS, unemployment rose by 2,600 in the Windsor CMA. More core-aged women, fewer core-aged men receive regular EI benefits In January, almost one-third (32.5%) of regular EI beneficiaries were core-aged men, while more than one-quarter (26.2%) were core-aged women. Compared with February 2020, women in all age groups accounted for a larger share of regular EI beneficiaries in January 2022, particularly young women aged 15 to 24 years (+2.8 percentage points). At the same time, there were declines in the shares of core aged men (-6.1 percentage points) and men aged 55 and older (-1.7 percentage points). Chart 2: Almost one-third of regular Employment Insurance (EI) beneficiaries were core-aged men Five industries account for over half of regular EI recipients Over one-third of regular EI recipients are longer-term beneficiaries January LFS results showed that 263,000 (19.6%) Canadians had been unemployed continuously for 27 weeks or more, compared with 180,000 (15.6%) in February 2020. Over half of longer-term regular EI recipients last worked in sales and service occupations or trades, transport and equipment operators and related occupations The number of monthly claims holds steady in January The number of claims received declined from December 2021 to January 2022 in seven provinces, led by Alberta (-23.6%; -8,000), Saskatchewan (-17.3%; -1,000) and British Columbia (-13.7%; -5,000). These decreases were offset by more claims in Ontario (+25.4%; +26,000), New Brunswick (+15.5%; +2,000) and Newfoundland and Labrador (+2.5%; +300). Next release Note to readers Data for the October 2020 reference period and onward comprise individuals who obtained EI benefits and exclude beneficiaries of the Canada recovery benefits (Canada Recovery Benefit, Canada Recovery Caregiving Benefit, and Canada Recovery Sickness Benefit). Concepts and methodology EI statistics are produced from administrative data sources provided by Service Canada and Employment and Social Development Canada. These statistics may, from time to time, be affected by changes to the Employment Insurance Act or administrative procedures. EI statistics indicate the number of people who received EI benefits and should not be confused with LFS data, which provide estimates of the total number of unemployed people. There is always a certain proportion of unemployed people who do not qualify for benefits. Some unemployed people have not contributed to the program because they have not worked in the past 12 months or their employment was not insured. Other unemployed people have contributed to the program, but do not meet the eligibility criteria, such as workers who left their jobs voluntarily or those who did not accumulate enough hours of work to receive benefits. All data in this release are seasonally adjusted, unless otherwise specified. Values for all series from March 2020 to January 2022 have been treated as outliers in determining a seasonal pattern for seasonal adjustment. For more information on seasonal adjustment, see Seasonally adjusted data – Frequently asked questions. The number of regular EI beneficiaries for the current month and the previous month is subject to revision. The number of beneficiaries is a measure of all people who received regular EI benefits from January 9 to 15, 2022. This period coincides with the reference week of the LFS. EI beneficiaries by industry A census metropolitan area (CMA) or census agglomeration (CA) is formed by one or more adjacent municipalities centred on a population centre. A CMA must have a total population of at least 100,000. A CA must have a population of at least 10,000. See Standard Geographical Classification 2016 – Definitions for more information. Data availability Next release Products Contact information Industry Intelligence Editor's Note: This press release omits select charts and/or marketing language for editorial clarity. Click here to view the full report.
The number of Canadians receiving regular EI benefits held steady in January at approximately 633,000.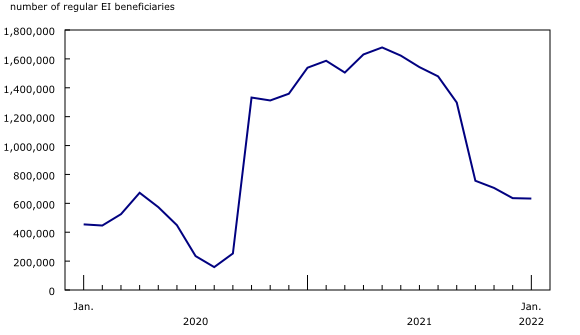
In January, the decreases in the number of regular EI beneficiaries in six provinces were offset by increases in Quebec (+10,000; +6.2%) and Prince Edward Island (+200; +1.9%). There was little change in the number of regular EI beneficiaries in Ontario and Manitoba. January LFS results indicated that employment decreased in Quebec (-63,000) and Prince Edward Island (-2,900).
Among core-aged (25 to 54 years) beneficiaries, the number of women receiving regular EI benefits increased by 5,000 (+3.2%) in January, while 6,000 (-2.7%) fewer men received regular EI benefits. January LFS results indicated that unemployment rose by 35,000 for core-aged women and by 12,000 for men in the same age group.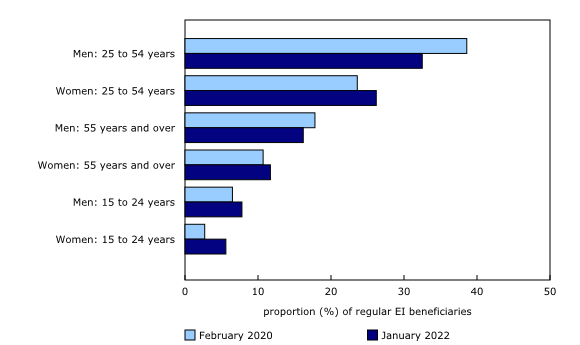
In January, over half (54.8%) of regular EI recipients last worked in one of the following five industries: 21.7% in construction; 9.3% in accommodation and food services; 9.1% in manufacturing; 7.5% in administrative and support services; and 7.3% in retail trade (not seasonally adjusted). January LFS results showed that employment in accommodation and food services (-26.4%; -324,000) remained further from its pre-pandemic February 2020 level than all other industries.
In January, 307,000 (38.2%) EI recipients received regular EI benefits in at least 7 of the last 12 months, compared with 95,000 (16.1%) in February 2020 (not seasonally adjusted). Among longer-term regular EI beneficiaries, close to one-third (31.0%) were core-aged men, while one-quarter (24.6%) were core-aged women. By province, the proportion of EI recipients who had received regular EI benefits in at least 7 of the last 12 months ranged from 30.3% in Quebec to 59.3% in Newfoundland and Labrador.
Among those who received regular EI benefits in January and who received regular EI benefits in at least 10 of the previous 12 months, over half (52.7%) last worked in either sales and service occupations (29.8%) or trades, transport and equipment operators and related occupations (22.9%) (not seasonally adjusted). Among longer-term regular EI beneficiaries who last worked in sales and service occupations, 43.1% worked and received part of their EI benefits during the same period. By comparison, occupations in art, culture, recreation and sport (1.5%) had the smallest proportion of longer-term regular EI beneficiaries who worked while on claim.
During January, there were 350,000 EI claims, compared with 432,000 in January 2021. The number of claims provides an indication of the number of people who could become beneficiaries. Claims data include initial and renewal claims received for any type of EI benefit, including special benefits.
Information on the profile of regular EI recipients for the week of February 13 to 19 will be released on April 21.
Employment Insurance in the context of broader COVID-19 benefit programs
No methodological changes have been made to the Employment Insurance Statistics (EIS) program over the COVID-19 pandemic period. EIS reflect the Employment Insurance (EI) program for the Labour Force Survey (LFS) reference week in each month.
The analysis focuses on people who received regular EI benefits related to job loss.
The industry of EI beneficiaries is determined by integrating EI data with record of employment administrative data. For beneficiaries with more than one record of employment in the 52 weeks prior to the reference week, the records with the greatest number of hours are used. If no industry information can be found, industry information is deemed "Not classified" for the beneficiary.
In the data tables 14-10-0004, 14-10-0005, 14-10-0007 and 14-10-0008, for the March to September 2020 reference periods, data have been suppressed because a source data file contains records for Canada Emergency Response Benefit claimants and beneficiaries who could not be identified and excluded through processing.
Data on EI for February will be released on April 21.
More information about the concepts and use of Employment Insurance statistics is available in the Guide to Employment Insurance Statistics (Catalogue number73-506-G).
For more information, or to enquire about the concepts, methods or data quality of this release, contact us (toll-free 1-800-263-1136; 514-283-8300; infostats@statcan.gc.ca) or Media Relations (statcan.mediahotline-ligneinfomedias.statcan@statcan.gc.ca).
* All content is copyrighted by Industry Intelligence, or the original respective author or source. You may not recirculate, redistrubte or publish the analysis and presentation included in the service without Industry Intelligence's prior written consent. Please review our terms of use.


