OTTAWA
,
May 19, 2022
(press release)
–
In March, 524,000 Canadians received regular Employment Insurance (EI) benefits, down by 41,000 (-7.2%) from February. March EI statistics reflect labour market conditions during the week of March 13 to 19, 2022. By the March reference week, provinces had continued to ease most public health restrictions. Most notably, all capacity limits and proof-of-vaccination requirements were lifted in Ontario, Manitoba, Alberta and Quebec prior to the March reference week. Fewer Canadians collect regular Employment Insurance benefits in March The decline in March coincides with information from the Labour Force Survey (LFS) showing the unemployment rate reaching a record low of 5.3% in March and employment growth totalling 409,000 in February and March. Chart 1: Fewer regular Employment Insurance beneficiaries in March The number of regular EI beneficiaries decreases in six provinces The number of beneficiaries fell in five other provinces, including Ontario (-9.0%; -14,000), Alberta (-8.5%; -5,000), British Columbia (-6.7%; -4,000), Manitoba (-6.7%; -1,000) and Saskatchewan (-4.5%; -1,000). At the same time, there were more regular EI beneficiaries in Prince Edward Island (+5.3%; +500) and New Brunswick (+3.1%; +1,000), and little change in Newfoundland and Labrador and Nova Scotia. On a regional basis, the census metropolitan areas (CMAs) of Ottawa – Gatineau (Québec part) (-23.1%; -1,000) and St. Catharines–Niagara (-16.5%; -1,000) posted the largest proportional decreases in regular EI beneficiaries in March. The CMAs of Montréal (-14.9%; -8,000) and Toronto (-8.9%; -6,000) accounted for more than one-third (34.4%) of the net monthly decline in regular EI recipients. Widespread decreases in regular Employment Insurance beneficiaries across all major demographic groups The number of beneficiaries receiving regular EI benefits fell by 4,000 (-9.3%) among young men aged 15 to 24, and by 3,000 (-9.1%) among young women in the same age group. The number of regular EI beneficiaries aged 55 and older also fell in March, including a decrease of 6,000 (-6.5%) among men and a drop of 3,000 (-4.6%) for women in this age group. According to the LFS results, employment among people aged 55 and older rose by 39,000 (+0.9%) in March, including an increase of 25,000 (+1.3%) among women. The number of long-term regular Employment Insurance recipients continues to decline despite elevated long-term unemployment Chart 2: Trades, transport and equipment occupations had the largest proportion of longer-term regular Employment Insurance beneficiaries without earnings in March The number of monthly claims decreases in all provinces The number of claims dropped in all provinces in March, with Newfoundland and Labrador having the largest proportional decrease (-28.7%; -3,000), followed by Quebec (-16.0%; -11,000), New Brunswick (-13.6%; -2,000) and Nova Scotia (-12.0%; -1,000). Next release Note to readers Data for the October 2020 reference period and onward comprise individuals who obtained EI benefits and exclude beneficiaries of the Canada recovery benefits (Canada Recovery Benefit, Canada Recovery Caregiving Benefit, and Canada Recovery Sickness Benefit). Concepts and methodology EI statistics are produced from administrative data sources provided by Service Canada and Employment and Social Development Canada. These statistics may, from time to time, be affected by changes to the Employment Insurance Act or administrative procedures. EI statistics indicate the number of people who received EI benefits and should not be confused with LFS data, which provide estimates of the total number of unemployed people. There is always a certain proportion of unemployed people who do not qualify for benefits. Some unemployed people have not contributed to the program because they have not worked in the past 12 months or their employment was not insured. Other unemployed people have contributed to the program, but do not meet the eligibility criteria, such as workers who left their jobs voluntarily or those who did not accumulate enough hours of work to receive benefits. All data in this release are seasonally adjusted, unless otherwise specified. Values for all series from March 2020 to March 2022 have been treated as outliers in determining a seasonal pattern for seasonal adjustment. For more information on seasonal adjustment, see Seasonally adjusted data – Frequently asked questions. The number of regular EI beneficiaries for the current month and the previous month is subject to revision. The number of beneficiaries is a measure of all people who received regular EI benefits from March 13 to 19, 2022. This period coincides with the reference week of the LFS. Employment Insurance beneficiaries by industry A census metropolitan area (CMA) or census agglomeration (CA) is formed by one or more adjacent municipalities centred on a population centre. A CMA must have a total population of at least 100,000. A CA must have a population of at least 10,000. See Standard Geographical Classification 2016 – Definitions for more information. Data availability Historical revision of EI data Next release Products Contact information Industry Intelligence Editor's Note: This press release omits select charts and/or marketing language for editorial clarity. Click here to view the full report.
The number of people collecting regular EI benefits continued to trend down in March as 41,000 (-7.2%) fewer Canadians received benefits compared with February.
The number of regular EI beneficiaries in Quebec fell by 16,000 (-12.0%) in March, consistent with LFS estimates which included employment growing (+27,000) in the month and the unemployment rate in the province reaching a record low of 4.1%.
In March, the number of core-aged (25 to 54 years) men receiving regular EI benefits fell by 17,000 (-9.2%), more than twice the decrease among core-aged women (-8,000; -5.3%). This is in line with March LFS results showing employment up by 35,000 (+0.5%) among men and little changed among women in the core working age group.
Based on LFS results, as of March 225,000 people had been unemployed and continuously searching for work for 27 weeks or more, little changed from February 2022 and 45,000 (+24.9%) higher than in February 2020. This elevated level of long-term unemployed captured by the LFS is reflected in EI statistics. In March, there were 229,000 regular EI beneficiaries without earnings that had received regular EI benefits in at least 7 of the last 12 months, down 3,800 (-1.6%) from a month earlier (not seasonally adjusted). Among longer-term regular EI beneficiaries without earnings, three-quarter (75.8%) of the decline in the number of regular EI beneficiaries from February to March was due to a decrease (-5.4%; -3,000) in the number of recipients who last worked in sales and service occupations (not seasonally adjusted).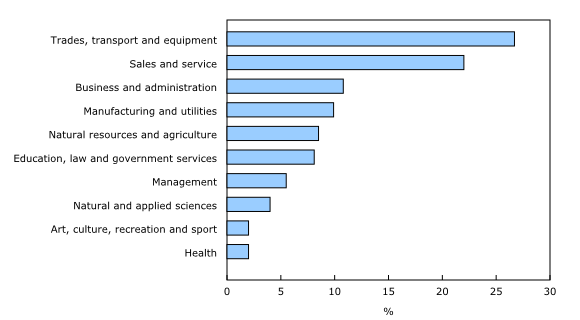
During March, there were 225,000 EI claims, down 31,000 (-12.2%) compared with one month earlier, and the lowest since July 2021. The number of claims provides an indication of the number of people who could become beneficiaries. Claims data include initial and renewal claims received for any type of EI benefit, including special benefits.
Information on the profile of regular EI recipients for the week of April 10 to 16 will be released on June 23.
Employment Insurance in the context of broader COVID-19 benefit programs
No methodological changes have been made to the Employment Insurance Statistics (EIS) program over the COVID-19 pandemic period. EIS reflect the Employment Insurance (EI) program for the Labour Force Survey (LFS) reference week in each month.
The analysis focuses on people who received regular EI benefits related to job loss.
The industry of EI beneficiaries is determined by integrating EI data with record of employment administrative data. For beneficiaries with more than one record of employment in the 52 weeks prior to the reference week, the records with the greatest number of hours are used. If no industry information can be found, industry information is deemed "Not classified" for the beneficiary.
In the data tables 14-10-0004, 14-10-0005, 14-10-0007 and 14-10-0008, for the March to September 2020 reference periods, data have been suppressed because a source data file contains records for Canada Emergency Response Benefit claimants and beneficiaries who could not be identified and excluded through processing.
With the release of Employment Insurance Statistics on June 23, Table 14-10-0009, which includes information on EI recipients by type of income benefit (not adjusted for seasonality) will be enhanced to include information on two additional benefit types: family caregiver benefits for children and family caregiver benefits for adults. In addition, all seasonally adjusted Employment Insurance Statistics tables will be updated on June 23, using updated seasonal factors. These data will be revised for January 2017 to March 2022.
Data on EI for April will be released on June 23.
More information about the concepts and use of Employment Insurance statistics is available in the Guide to Employment Insurance Statistics (Catalogue number73-506-G).
For more information, or to enquire about the concepts, methods or data quality of this release, contact us (toll-free 1-800-263-1136; 514-283-8300; infostats@statcan.gc.ca) or Media Relations (statcan.mediahotline-ligneinfomedias.statcan@statcan.gc.ca).
* All content is copyrighted by Industry Intelligence, or the original respective author or source. You may not recirculate, redistrubte or publish the analysis and presentation included in the service without Industry Intelligence's prior written consent. Please review our terms of use.


