OTTAWA
,
April 20, 2022
(press release)
–
National overview Chart 1: New Housing Price Index Construction costs continue to rise throughout Canada Demand for new homes in more affordable population centres continues to be strong in March, despite looming interest rate hikes Winnipeg recorded the second highest increase of new home prices in March (+3.4%). According to the Winnipeg Real Estate Board, active listings had already begun to decline prior to 2020, when the demand started to outpace the new supply of homes coming onto the market. Prices for new homes in Montréal (+3.2%) and in Sherbrooke (+3.1%) also increased in March. According to The Quebec Professional Association of Real Estate Brokers, both municipalities continued to experience inventory shortages for resale homes as of the fourth quarter of 2021. Year-over-year prices continue to rise across the country Kitchener–Cambridge–Waterloo (+24.4%) reported the greatest year-over-year increase for the 7th month in a row in March. The second highest increase was observed in Winnipeg (+24.3%), the largest price increase in this CMA since the beginning of the series. In Calgary, its year-over-year increase (+23.0%) in March was the highest since the price of new homes surged during the housing market boom of 2006-2007. Chart 2: New house prices rise at the national level Note to readers The prices collected from builders and included in the index are market selling prices less value-added taxes, such as the federal Goods and Services Tax and the provincial harmonized sales tax. The survey covers the following dwelling types: new single homes, semi-detached homes and townhomes (row or garden homes). The index is available at the national and provincial levels and for 27 census metropolitan areas (CMAs). The index is not subject to revision and is not seasonally adjusted. Products The article titled "The resilience and strength of the new housing market during the pandemic" examines the changes in new home prices in Canada for the 27 surveyed CMAs captured in the NHPI and compares the ranking of cities based on prices six months into the pandemic (August 2020 compared with February 2020). The New Housing Price Index: Interactive Dashboard, which allows users to visualize statistics on new housing prices, is available. The Housing Market Indicators dashboard, which provides access to key housing market indicators for Canada, by province and by CMA, is also available. For more information on the topic of housing, visit the Housing statistics portal. The video Producer price indexes is available on the Statistics Canada Training Institute webpage. It provides an introduction to Statistics Canada's Producer Price Indexes—what they are, how they are compiled and what they are used for. Statistics Canada launched the Producer Price Indexes Portal as part of a suite of portals for prices and price indexes. It provides users with a single point of access to a wide variety of statistics and measures related to producer prices. Next release Contact information Industry Intelligence Editor's Note: This press release omits select charts and/or marketing language for editorial clarity. Click here to view the full report.
In March, new home prices for Canada rose 1.2% compared with February. Prices were up in 18 of the 27 census metropolitan areas (CMAs) surveyed and unchanged in 9 from February to March.
Most new home builders surveyed continued to cite rising construction costs as the main reason for price increases. Softwood lumber prices were still rising (+8.3%) on a monthly basis in February. At the same time, prices for energy and petroleum products rose by 10.0% in January and 8.5% in February, as reflected in higher transportation costs and in higher operational costs for heavy machinery.
For the third month in a row, Calgary (+4.1%) registered the largest month-over-month increase for the price of new homes in March. According to the Calgary Real Estate Board, March saw the highest amount of sales ever recorded. Despite the increase in new listings, the overall inventory of resale homes remained low. This market favourable to sellers may have had an impact on the demand of new built homes as the low inventory levels on the resale market may have swayed some buyers towards the new home market, contributing to the rise of new homes prices over the last few months.
Nationally, new home prices rose 11.0% year over year in March.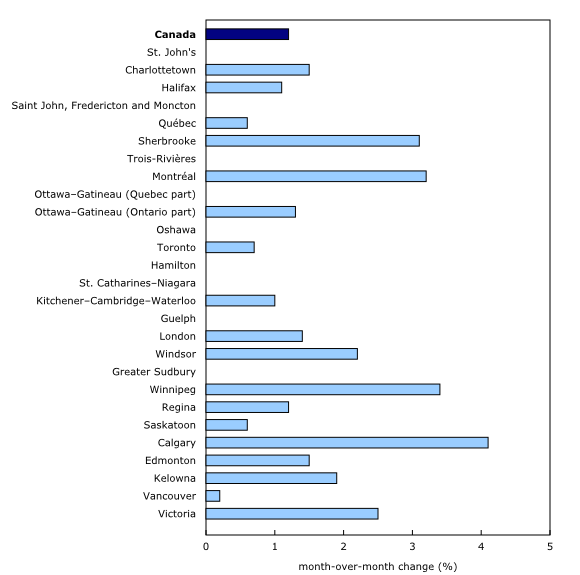
The New Housing Price Index (NHPI) measures changes over time in the selling prices of new residential houses. The prices are those agreed upon between the contractor and the buyer at the time the contract is signed. The detailed specifications for each new house remain the same between two consecutive periods.
The Technical Guide for the New Housing Price Index (NHPI) is now available. This document provides details on the methodology used to calculate the NHPI.
The New Housing Price Index for April will be released on May 19.
For more information, or to enquire about the concepts, methods or data quality of this release, contact us (toll-free 1-800-263-1136; 514-283-8300; infostats@statcan.gc.ca) or Media Relations (statcan.mediahotline-ligneinfomedias.statcan@statcan.gc.ca).
* All content is copyrighted by Industry Intelligence, or the original respective author or source. You may not recirculate, redistrubte or publish the analysis and presentation included in the service without Industry Intelligence's prior written consent. Please review our terms of use.


