April 12, 2022
(press release)
–
Prospects for the global economy have darkened since the outbreak of war in Ukraine on 24 February, prompting WTO economists to reassess their projections for world trade over the next two years. The organization now expects merchandise trade volume growth of 3.0% in 2022—down from its previous forecast of 4.7%—and 3.4% in 2023, but these estimates are less certain than usual due to the fluid nature of the conflict (Table 1). The most immediate economic impact of the crisis has been a sharp rise in commodity prices. Despite their small shares in world trade and output, Russia and Ukraine are key suppliers of essential goods including food, energy, and fertilizers, supplies of which are now threatened by the war. Grain shipments through Black Sea ports have already been halted, with potentially dire consequences for food security in poor countries. The war is not the only factor weighing on world trade at the moment. Lockdowns in China to prevent the spread of COVID-19 are again disrupting seaborne trade at a time when supply chain pressures appeared to be easing. This could lead to renewed shortages of manufacturing inputs and higher inflation. "The war in Ukraine has created immense human suffering, but it has also damaged the global economy at a critical juncture. Its impact will be felt around the world, particularly in low-income countries, where food accounts for a large fraction of household spending," Director-General Ngozi Okonjo-Iweala said. "Smaller supplies and higher prices for food mean that the world's poor could be forced to do without. This must not be allowed to happen. This is not the time to turn inward. In a crisis, more trade is needed to ensure stable, equitable access to necessities. Restricting trade will threaten the wellbeing of families and businesses and make more fraught the task of building a durable economic recovery from COVID‑19," the Director-General went on to say. She said governments and multilateral organizations must work together to facilitate trade at a time of sharp inflationary pressures on essential supplies and growing pressures on supply chains. "History teaches us that dividing the world economy into rival blocs and turning our backs on the poorest countries leads neither to prosperity nor to peace. The WTO can play a pivotal role by providing a forum where countries can discuss their differences without resorting to force, and it deserves to be supported in that mission," she said. With little hard data on the economic impact of the conflict, WTO economists have had to rely on simulations to generate reasonable assumptions about GDP growth in 2022 and 2023. Current estimates based on the WTO Global Trade Model capture (1) the direct impact of the war in Ukraine, including destruction of infrastructure and increased trade costs; (2) the impact of sanctions on Russia, including the blocking of Russian banks from the SWIFT settlement system; and (3) reduced aggregate demand in the rest of the world due to falling business/consumer confidence and rising uncertainty. Under these assumptions, world GDP at market exchange rates is expected to grow by 2.8% in 2022, down 1.3 percentage points from the previous forecast of 4.1%. Growth should pick up to 3.2% in 2023, close to the average rate of 3.0% between 2010 and 2019. Output in the Commonwealth of Independent States (CIS) region—which excludes Ukraine—is expected to see a sharp 7.9% drop, leading to a 12.0% contraction in the region's imports. Chart 1 shows quarterly world merchandise trade volume estimates through the end of 2023, including error bands indicating confidence intervals associated with the forecast. Given current GDP assumptions, merchandise trade volume growth in 2022 could be as low as 0.5% or as high as 5.5%. These projections will be updated in October, but an earlier revision could be issued if incoming data warrant it. The forecast takes into account higher frequency data for selected economies, including monthly statistics on container throughput of U.S. and Chinese ports in order to capture port congestion in these countries. Chart 1: Volume of world merchandise trade, 2015Q1-2023Q4 Source: WTO and UNCTAD, WTO Secretariat estimates. Chart 2 illustrates the recent rise in world fuel prices, which pre-dates the conflict in Ukraine. The benchmark Brent crude oil price for March came in at US$ 118 per barrel, up 38% from its level in January and up 81% year-on-year. (It should be noted that daily prices have moderated recently, from a peak of US$ 128 per barrel on 8 March to US$ 104 per barrel on 1 April.) Unlike oil prices, natural gas prices tend to diverge strongly across regions. The price of natural gas in Europe rose 45% between January and March to US$ 41.0 per million Btu, whereas prices remained relatively low in the United States at around US$ 4.9 per million Btu. Higher oil prices may reduce real incomes and import demand worldwide, while higher natural gas prices would probably have a greater impact in Europe. Chart 2: Monthly average prices for crude oil and natural gas, January 2018 – March 2022 Source: World Bank, US Energy Information Administration, Federal Reserve Bank of St. Louis. In the two decades before the global financial crisis, world merchandise trade volume grew around twice as fast as world GDP at market exchange rates, but the ratio between trade growth and GDP growth fell to around 1:1 on average after the crisis. If the current forecast is realized, this ratio would be 1.1:1 in both 2022 and 2023, suggesting no fundamental change in the relationship between trade and output. Risks to the forecast are mixed and difficult to assess objectively. There is some upside potential if the war in Ukraine ends sooner than expected, but substantial downside risks could emerge if fighting persists for a long time or if the conflict escalates. Chart 3 shows quarterly merchandise trade volume indices by region from the first quarter of 2019 to the final quarter of 2023, at the end of the forecast period. Regional disparities in the forecasts persist, but Europe is now expected to underperform on the import side along with Africa and the CIS. The latter is mostly due to sanctions against Russia. Meanwhile, Middle East import volumes are expected to pick up as higher oil prices boost export revenues, allowing countries in the region to import more. Weakness in Europe is partly due to the fact that Ukraine is included in this country group, dragging down the regional average. The low level of imports in Africa is partly due to unexpected declines in the second half of 2021, which are projected forward into the future. Export volumes show slow growth in most regions, including the CIS, since Russia is still able to export fuels. If the situation were to change, we might see stronger export volume growth in other fuel producing regions. Chart 3: Merchandise exports and imports by region, 2019Q1-2023Q4 a Refers to South and Central America and the Caribbean. Table 1 summarizes annual merchandise trade volume growth since 2018 and projections for 2022 and 2023. Annual volume indices sometimes differ slightly from the quarterly indices due to differences in methodology, but they generally tell the same story. In addition to the standard WTO regions, the table also includes experimental forecasts for Least-Developed Countries (LDCs). The year 2021 saw a sharp rebound in trade volumes after the pandemic-induced slump of 2020, but growth might have been stronger without recurring waves of COVID-19 during the year. Every region had export growth below the world average of 9.8% except for Asia, which saw its exports increase by 13.8%. The situation was reversed on the import side, where North America, South America, the CIS and Asia all recorded above average growth. The forecast foresees 2022 export volume growth of 3.4% in North America, -0.3% in South America, 2.9% in Europe, 4.9% in the CIS, 1.4% in Africa, 11.0% in the Middle East, and 2.0% for Asia. It also anticipates import growth of 3.9% in North America, 4.8% in South America, 3.7% in Europe, -12.0% in the CIS, 2.5% in Africa, 11.7% in the Middle East and 2.0% in Asia. LDCs should see their export and import volumes increase by 3.5% and 6.6% respectively in 2022. Except for the Middle East, all regions saw forecasts for 2023 revised downward. Trade costs should rise in the short run as a result of sanctions, export restrictions, energy costs and disruptions in transport due to COVID-19. Table 1: Merchandise trade volume and real GDP, 2018-2023 a a Figures for 2022 and 2023 are projections. Trade developments in value terms Chart 4 shows estimated year-on-year and 24-month growth rates for selected categories of manufactured goods in 2021. Quarterly developments show steady year-on-year growth in certain products (iron and steel, chemicals, integrated circuits) and weaker growth for others (clothing, machinery). Trade values for pharmaceuticals, computers and integrated circuits were actually higher in 2021 than before the pandemic, probably due to high demand for COVID-19 vaccines and increased prevalence of remote working. In contrast, trade in automotive products was up 14% year-on-year in 2021 but down 4% compared to 2019. Chart 4: Year-on-year growth in manufactured goods trade, 2021 Source: WTO estimates based on partner statistics. World trade in commercial services was up 15% year-on-year in 2021, boosted by demand for transport services, which grew 33% (Chart 5). Growth of travel exports was positive but it remained weak, as travel restrictions were only partially eased during the year. The category Other services, which includes financial and business services, was up 12% compared to the previous year. Western sanctions on Russian businesses and individuals are likely to have a strong effect on commercial services trade. Russia is a net services importer, with imports in 2021 valued at US$ 74 billion and exports totalling US$ 55 billion. Russia is ranked 24th among services exporters (13th excluding intra-EU trade), with a share in world trade of 0.9%. It is ranked 19th among importers (11th excluding intra-EU) with a 1.4% share in world trade. In 2019, the European Union accounted for more than 42% of Russia's services imports and 31.1% of its services exports. In the same year Russia also sourced services from Turkey (7.7%), the United Kingdom (5.1%), the United States (4.0%), China (3.7%), and Switzerland (3.3%), among others. The United States (6.5%), China (6.2%), Switzerland (6.1%), and the United Kingdom (4.8%) were main non-EU destinations for Russian services exports. Prior to the pandemic, travel/tourism and air transport services were the largest traded services by Russia, accounting for 46% of its exports and 36% of its imports. These services, already hit hard by the pandemic, may be heavily affected by economic sanctions. Ireland is exposed due to the prominent role of the country in operational leasing of aircraft. Overall, Russian payments for operational leasing of aircraft, boats, etc. from the EU reached $3.9 billion in 2019, of which $2.6 billion were for leasing services from Ireland. In 2020, Russian operational leasing imports fell 44% due to pandemic-related travel restrictions. Intellectual property services were the third biggest category of services imported by Russia. The European Union, Switzerland, the United States, the United Kingdom, the Republic of Korea, and Japan together provided 96% of Russia's imports in 2019, worth some US$ 6.6 billion. This includes fees for the use of patents, outputs from research and development, industrial processes/designs, franchises and trademarks, among others. Chart 5: Year-on-year growth in world commercial services trade, 2019-2021 Note: Average of exports and imports. Detailed quarterly and annual statistics on merchandise and commercial services trade can be downloaded from stats.wto.org. A statistical supplement showing country ranks and shares in world trade can be downloaded here. Supplemental Indicators The latest RWI/ISL container throughput index showed seasonally-adjusted throughput declining 3.6 points to 117.1 in February (Chart 6). The index incorporates container data on container handling at 94 international ports, accounting for 64 percent of the global total. Chinese ports saw the biggest decline in March, but European ports also registered a substantial decline. The data could be influenced by seasonal adjustments, but it could also reflect the early stages of the conflict in Ukraine. The fact that the shipping rates have been steady or declining at the same time suggest that the dip in throughput represents falling demand for shipping services rather than reduced supply. Chart 6: RWI/ISL container throughput index, January 2015 - February 2022 Source: Leibniz Institute for Economic Research. Purchasing managers' indices (PMIs) from IHS-Markit are based on surveys of hundreds of businesses in more than 40 countries. These are aggregated into a global index and several sub-indices, with values greater than 50 indicating expansion and values less than 50 denoting contraction (Chart 7). The Headline Global PMI (53.0) remained above the threshold value of 50 in March, suggesting that manufacturing output may still be expanding but at a reduced pace. Meanwhile, New Export Orders fell to 48.2, its lowest level since July 2020, signalling slower growth or possibly contraction in world trade. Supply chains have been hampered in recent months by long delivery times and shortages of production inputs such as semiconductors. The indices shown in the right panel of Chart 7 suggest that these issues are not yet resolved. A rise in input and output prices and an uptick in delivery times in March 2022 suggest continued supply-demand imbalances that could contribute to inflation in the coming months. Chart 7: Global Manufacturing Purchasing Managers' Indices (PMIs), January 2018 - March 2022 Source: IHS-Markit. Finally, Chart 8 below shows the daily volume and average tone of news reports containing phrases related to economic activity, as monitored by the GDELT Project Summary Service. Although the intensity of reporting on these issues remained flat in recent weeks, the tone took a negative turn in late February. The fact that that this downturn coincided with the start of hostilities in Ukraine suggest that the conflict may be damaging economic sentiment. Chart 8: GDELT phrases related to economic activity, 01 September 2020 – 30 March 2022 Source: The GDELT Project Summary Service.
Seasonally-adjusted volume index, 2015=100
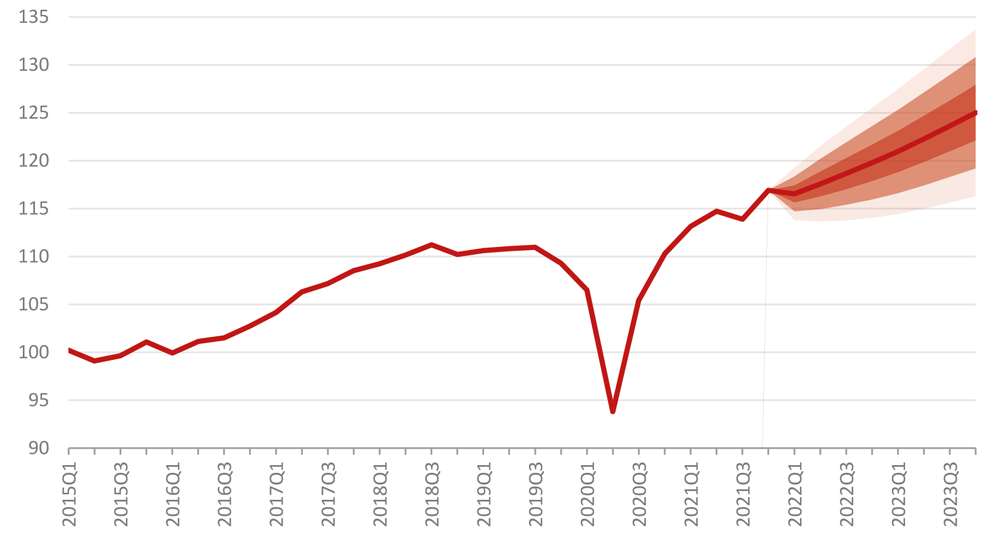
Note: Each shaded region represents a +-0.5 standard error band around the central forecast.
US$ per barrel and US$ per million Btu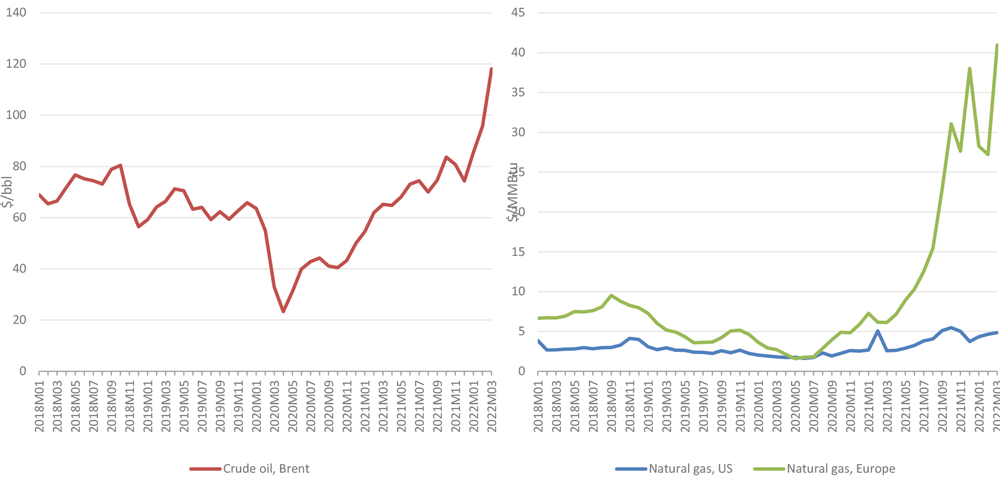
Volume index, 2019=100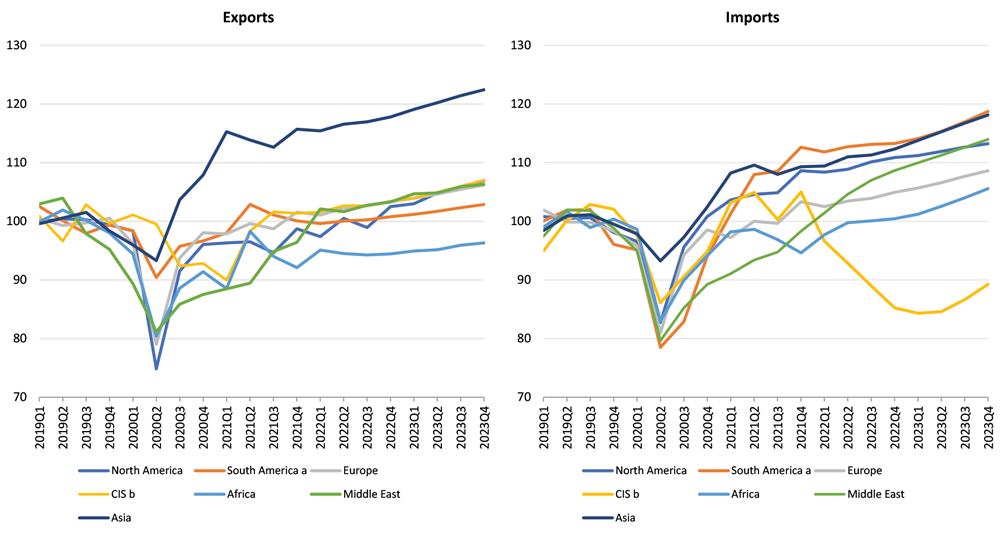
b Refers to the Commonwealth of Independent States, including certain associate and former member.
Source: WTO and UNCTAD.
Annual % change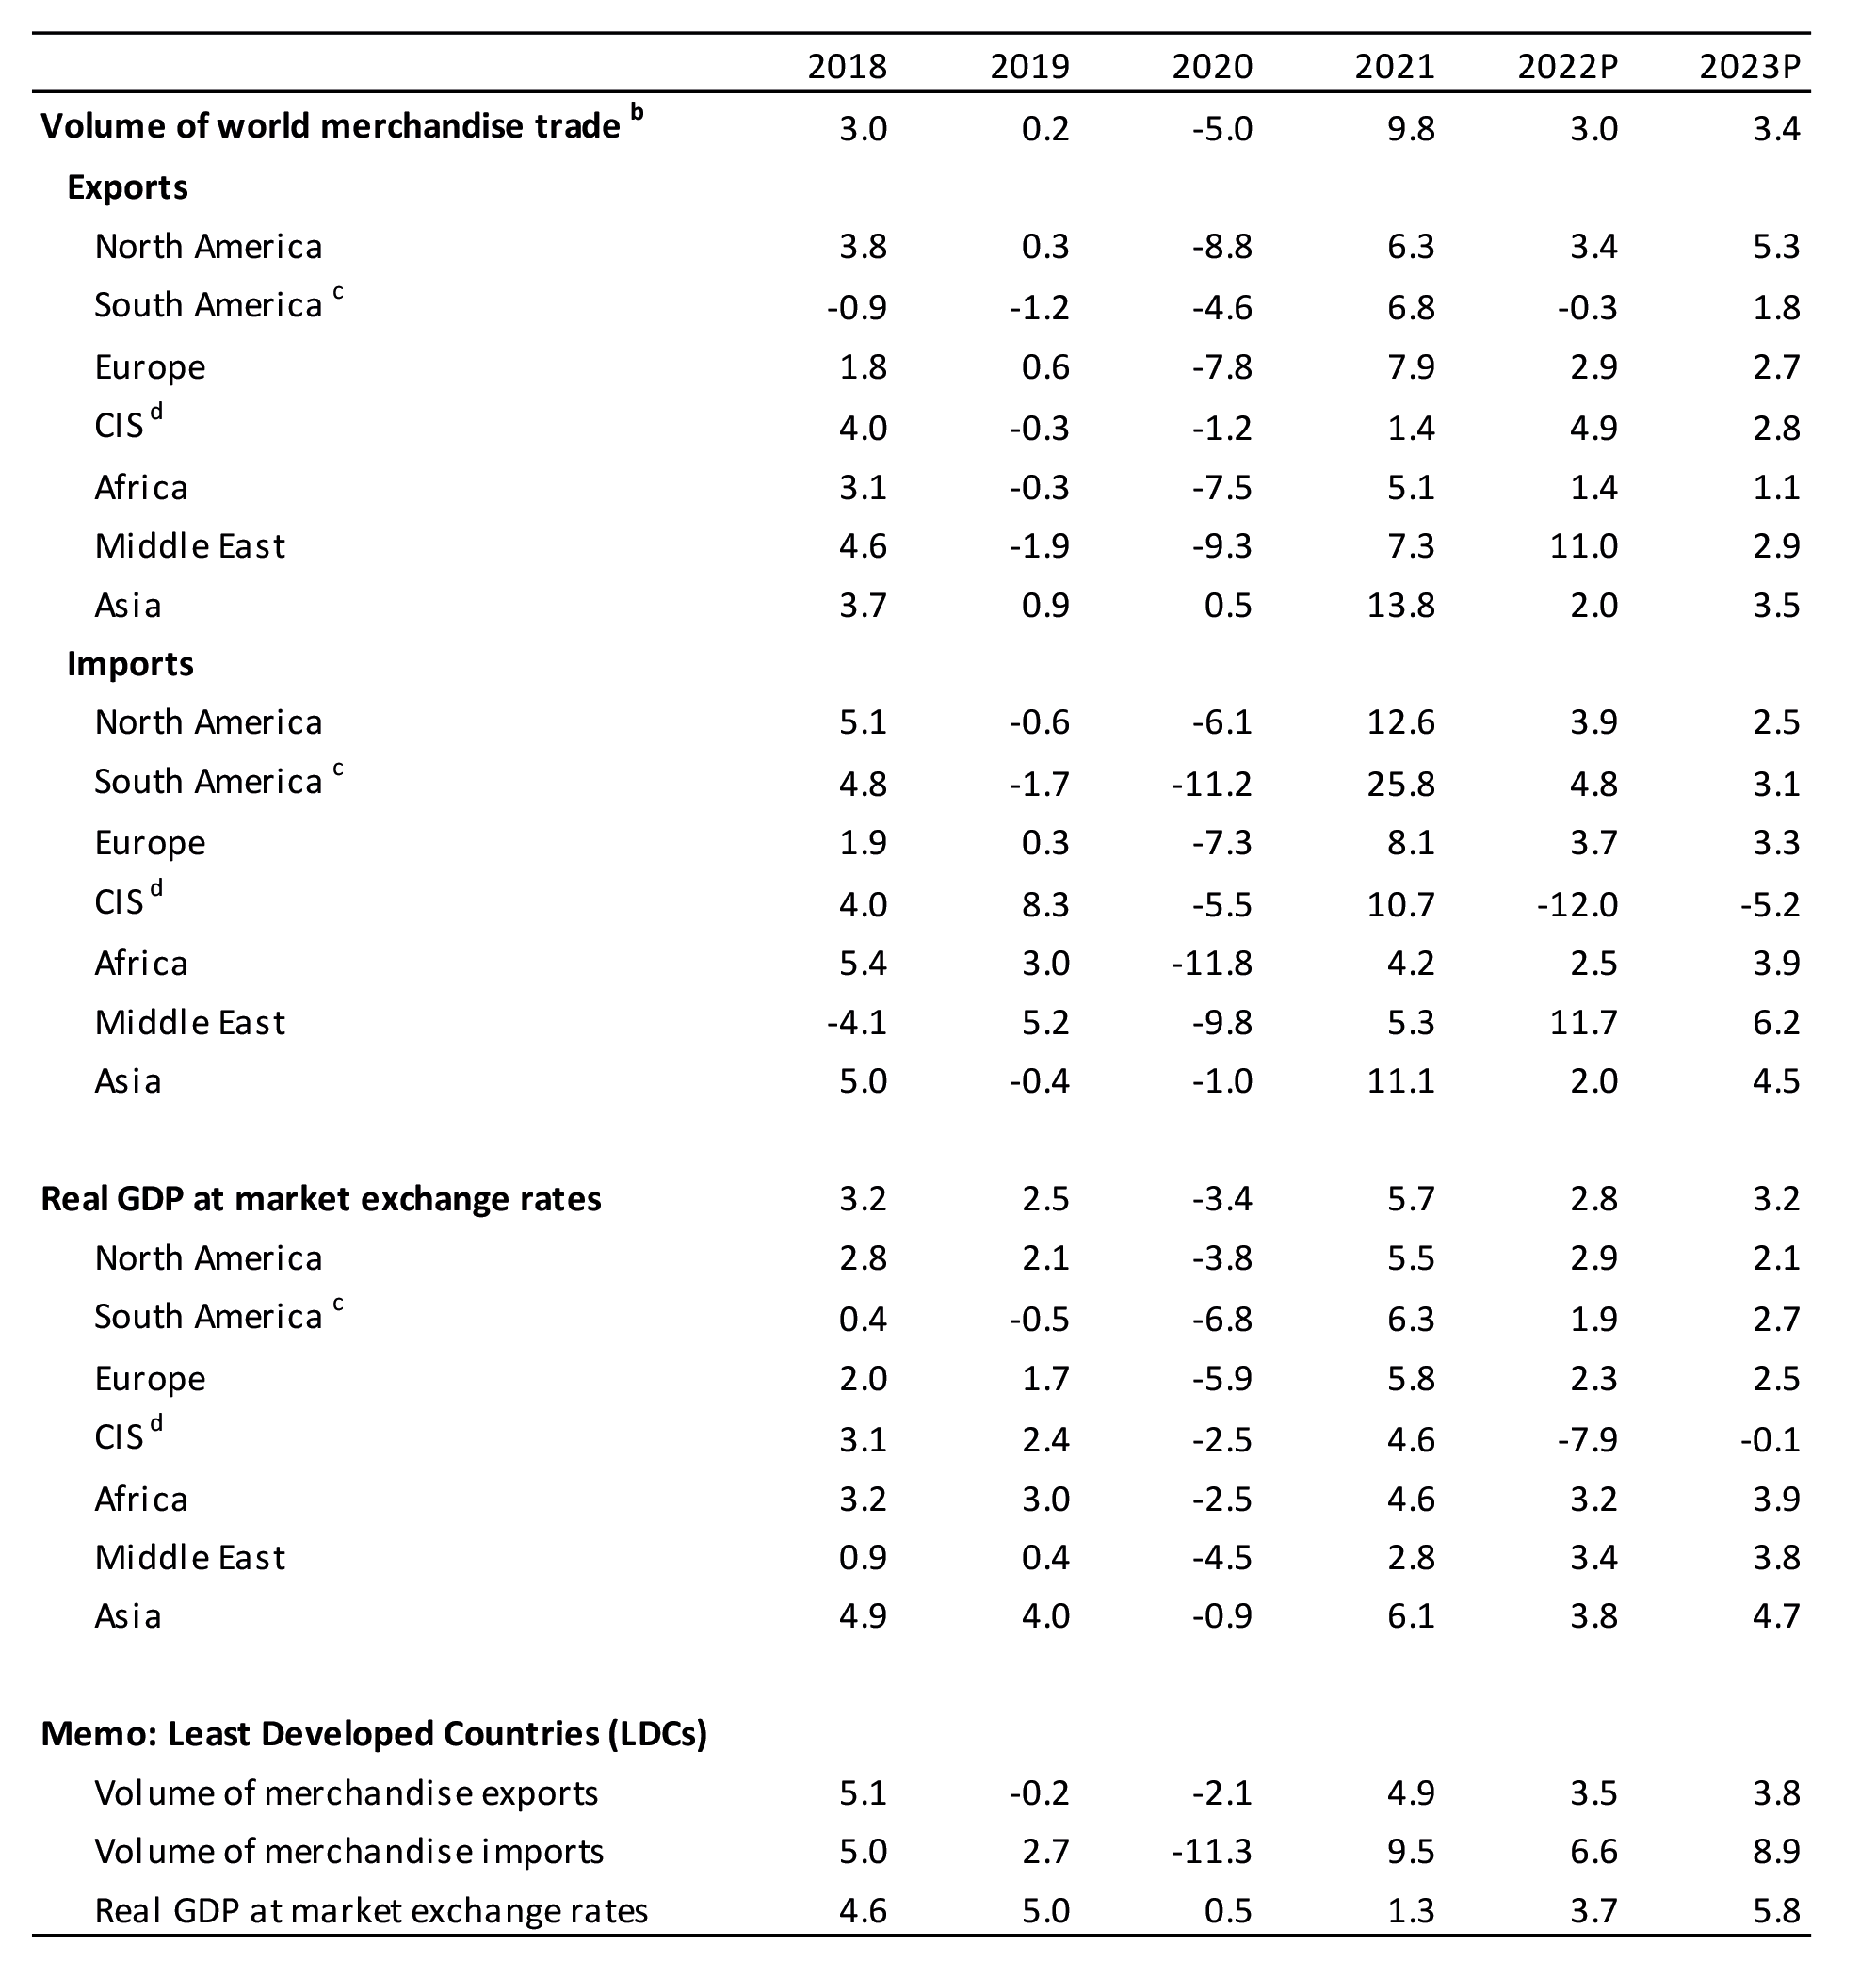
b Average of exports and imports.
c Refers to South and Central America and the Caribbean.
d Refers to Commonwealth of Independent States (CIS), including certain associate and former member States.
Note: These projections incorporate mixed-data sampling (MIDAS) techniques for selected countries to take advantage of higher-frequency data such as container throughput and financial risk indices.
Source: WTO for trade, consensus estimates for GDP.
The WTO's trade forecast is released in conjunction with annual merchandise and commercial services trade statistics in current U.S. dollar terms. These figures can be downloaded from the WTO's online database at stats.wto.org. Merchandise trade growth in nominal terms diverged strongly from growth in (real) volume terms in 2021 due to strong price fluctuations over the course of the year. World merchandise trade as measured by the average of exports and imports rose 26% in 2021, which implies that export and import prices jumped 15% for the year on average. The dollar value of trade in fuels and mining products was up 59%, agricultural products were up 19%, and manufactures were up 21%.
% change in US$ values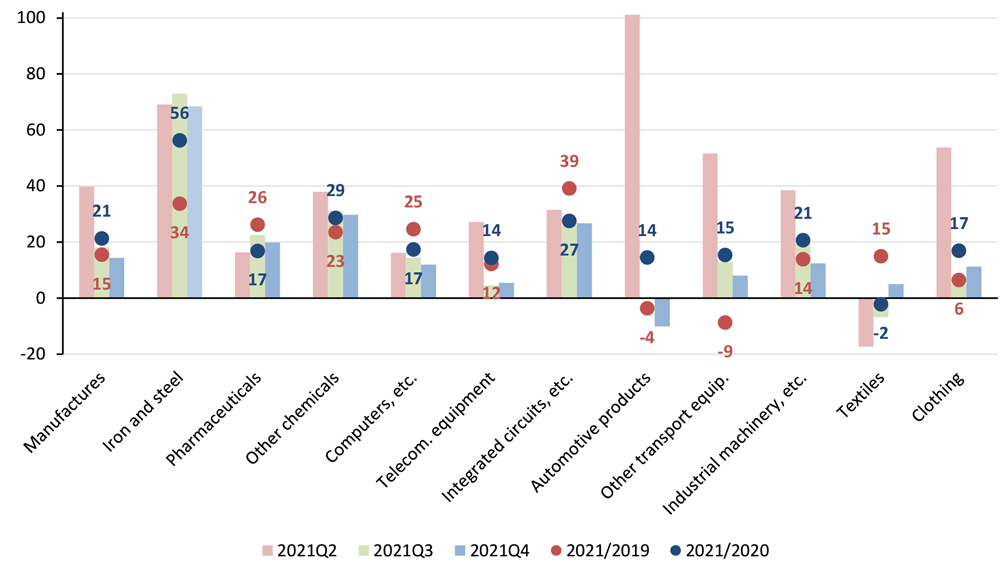
% change in US$ values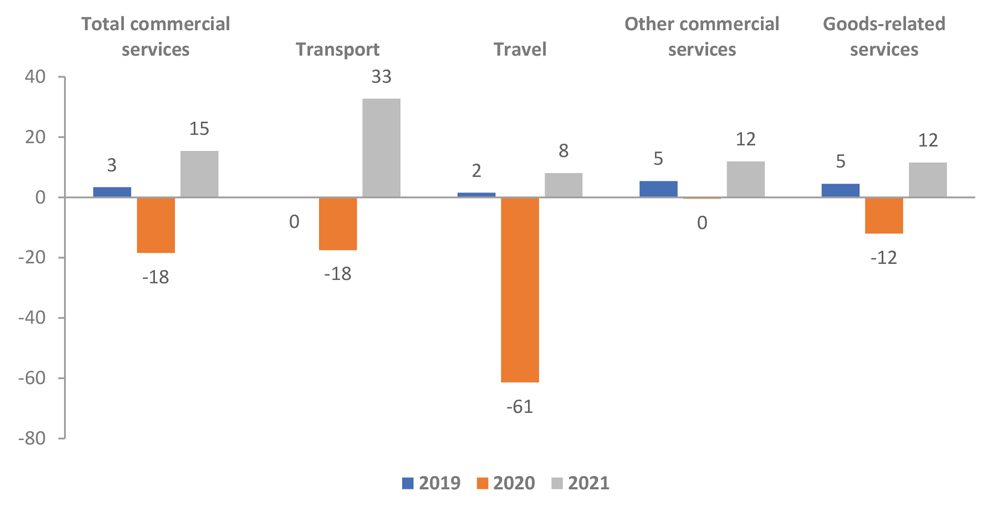
Source: WTO-UNCTAD estimates in cooperation with ITC.
The WTO tracks a number of timely, high-frequency trade-related indicators to better understand trends in merchandise and commercial services trade. A selection of these is presented below to provide additional context to the trade statistics and forecast.
Index, 2015=100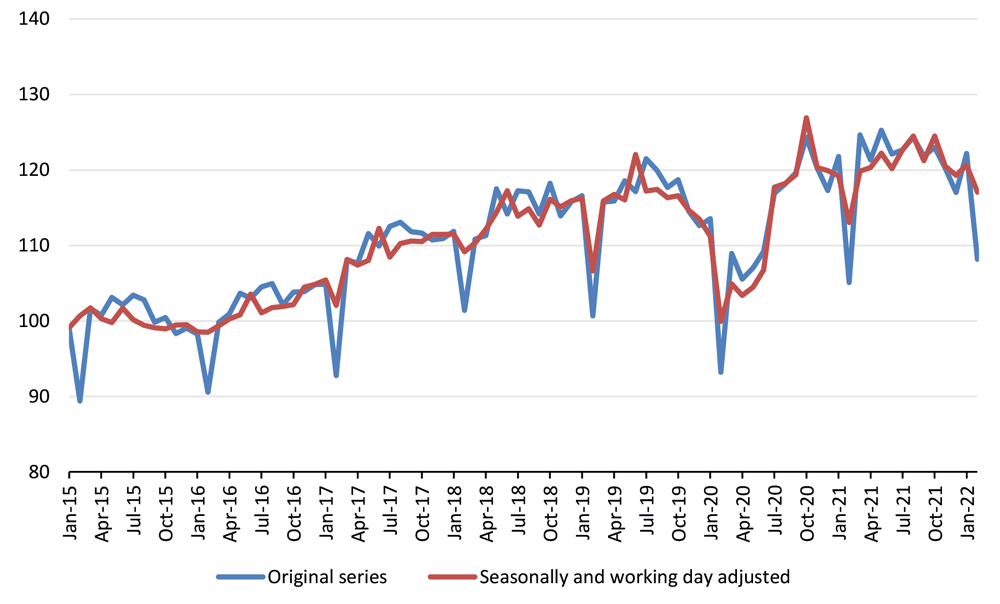
Index, base = 50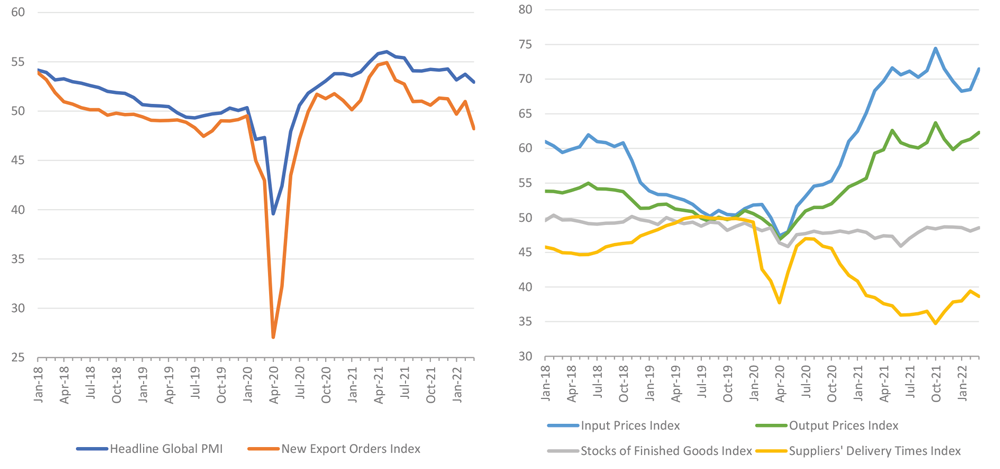
Note: Values greater than 50 indicate expansion while values less than 50 denote contraction.
% and index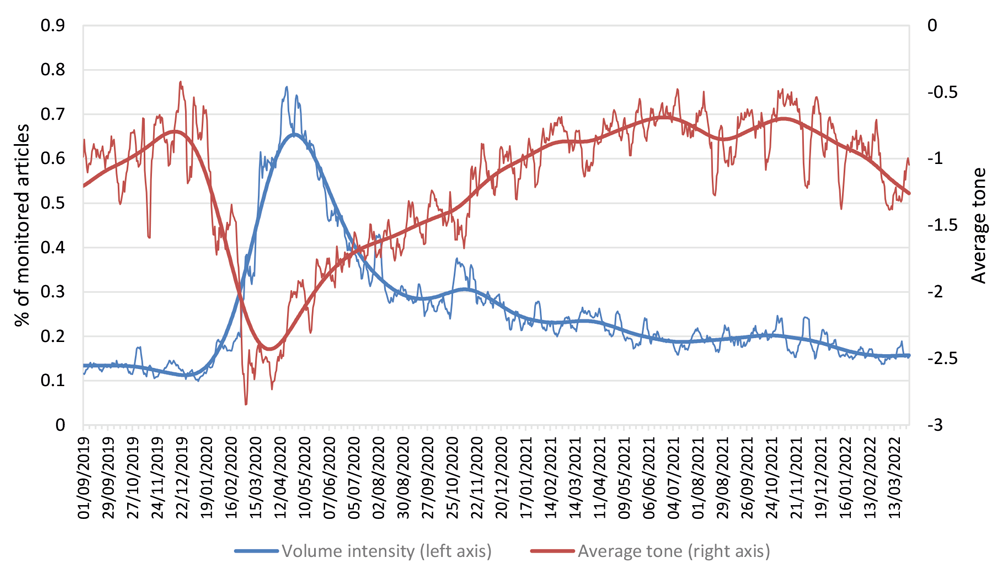
* All content is copyrighted by Industry Intelligence, or the original respective author or source. You may not recirculate, redistrubte or publish the analysis and presentation included in the service without Industry Intelligence's prior written consent. Please review our terms of use.


