OTTAWA
,
March 31, 2023
(press release)
–
Real gross domestic product (GDP) rose 0.5% in January, following a slight contraction (-0.1%) in December. Both goods-producing (+0.4%) and services-producing (+0.6%) industries were up in January, as 17 of 20 industrial sectors posted increases. Chart 1: Real gross domestic product rises in January Advance information indicates that real GDP increased 0.3% in February. Increases in the mining, quarrying, and oil and gas extraction, manufacturing, and finance and insurance sectors were slightly offset by decreases in construction, wholesale trade, and accommodation and food services. Owing to its preliminary nature, these estimates will be updated based on more complete data with the release of the official GDP data for the month of February on April 28. Rebounds in several industries drive the gain Wholesale activity rebounds in January Wholesalers of machinery, equipment, and supplies (+2.4%), specifically construction and industrial equipment, drove the increase in January, as imports of industrial machinery, equipment and parts rose, coinciding with strong imports of machinery and parts for the new liquefied natural gas terminal being constructed in British Columbia. Mining, quarrying and oil and gas extraction rebounds as oil sands extraction expands Chart 2: Mining, quarrying, and oil and gas extraction increases in January Oil and gas extraction rose 1.1% in January, led by oil sands extraction (+1.8%) as extraction and exports of crude bitumen increased. Still, unplanned upgrader maintenance constrained production of upgraded synthetic oil, which tempered the overall growth in the oil and gas extraction subsector. Oil and gas extraction (except oil sands) was essentially unchanged in January, as an increase in natural gas production was offset by a decrease in conventional crude oil production, primarily due to lower offshore production in Newfoundland and Labrador and Saskatchewan. Mining and quarrying (excluding oil and gas extraction) rose 1.0% in January, led by a sharp increase in coal mining (+22.5%) as exports, particularly to China, rose. Declines in non-metallic mineral mining and quarrying (-2.0%) and metal ore mining (-0.5%) partially offset increases in the sector. Manufacturing activity rises Durable goods manufacturing grew 1.2% in January, up for a third consecutive month. Machinery, miscellaneous, fabricated metal, and transportation equipment manufacturing drove the increase in the month. Motor vehicle manufacturing (+20.0%) posted the largest increase within the manufacturing sector. Exports of passenger cars and light trucks rose 18.7%, as easing supply chain and shipping capacity constraints alongside an increase in production days in January paved the road to higher production. Non-durable goods manufacturing contracted 0.3% in January, its sixth consecutive decline. The chemical manufacturing subsector (-6.3%) led the decrease. Lower activity in the pharmaceutical and medicine manufacturing industry contributed the most to the decline, with exports falling 2.0% in January. A gain in food product manufacturing (+1.8%) partially offset the overall decline in non-durable goods. Construction expands Engineering and other construction activities (+1.2%) continued its long-term ascent and was the main driver of growth in the sector. Residential building construction (+0.6%) was another large contributor to the growth, rising for the 2nd time in 10 months as home alterations and improvement drove the gain in January. Non-residential building construction (+0.3%) posted a second consecutive increase as industrial building construction and alterations and improvement expanded. Repair construction (+0.4%) expanded for the first time in four months due to gains in both residential and non-residential repairs. Transportation and warehousing rebounds following adverse weather in December Chart 3: Transportation and warehousing sector increases in January Rail transportation (+12.1%) contributed the most to the January increase, its largest growth rate since May 2014, as carloadings of several major commodities including coal, iron ore and fertilizers as well as passenger vehicles increased in January 2023. A rebound in domestic air travel in January contributed to an increase in air transportation (+0.2%) after December's decline. Accommodation and food services expands After rebounding from the effects of Omicron in the first half of 2022, activity in the food services and drinking places subsector remained relatively flat in the second half of the year. The January increase (+4.9%) followed a decline in November and a slight gain in December. This was the first January since the start of the COVID-19 pandemic with no COVID-19 restrictions impacting the subsector. Arts, entertainment and recreation records a gain in January In January, there were more home games hosted by Canadian NHL teams than usual, specifically the Toronto Maple Leafs and Montréal Canadiens. This, coupled with the World Junior hockey tournament occurring in both New Brunswick and Nova Scotia, drove the increase. Public sector continues to grow Chart 4: Main industrial sectors' contribution to the percent change in gross domestic product in January Note to readers For the period starting in January 2020, data are derived by chaining a fixed-weight Laspeyres volume index to the previous period. The fixed weights are 2019 industry prices. This approach makes the monthly GDP by industry data more comparable with expenditure-based GDP data, which are chained quarterly. All data in this release are seasonally adjusted. For information on seasonal adjustment, see Seasonally adjusted data – Frequently asked questions. An advance estimate of industrial production for February 2023 is available upon request. For more information on GDP, see the video "What is Gross Domestic Product (GDP)?" Revisions Each month, newly available administrative and survey data from various industries in the economy are integrated, resulting in statistical revisions. Updated and revised administrative data (including taxation statistics), new information provided by respondents to industry surveys, data confrontation and reconciliation process and standard changes to seasonal adjustment calculations are incorporated with each release. Real-time table Next release Products The Methodological Guide: Canadian System of Macroeconomic Accounts (Catalogue number13-607-X) is also available. The Economic accounts statistics portal, accessible from the Subjects module of the Statistics Canada website, features an up-to-date portrait of national and provincial economies and their structure. Contact information Industry Intelligence Editor's Note: This press release omits select charts and/or marketing language for editorial clarity. Click here to view the full report.
Many of the main drivers of growth in January were also the largest contributors to the December decline. In January, the wholesale trade, transportation and warehousing, and mining, quarrying and oil and gas extraction sectors all rebounded from declines recorded in the previous month. After remaining relatively flat in the second half of 2022, activity in accommodation and food services was also among the top contributors to growth in January, led by food services and drinking places.
Wholesale trade rose 1.8% in January, more than offsetting the declines observed in the previous two months. Overall, seven of nine subsectors posted gains.
Mining, quarrying and oil and gas extraction expanded 1.1% in January after the sector stepped back 3.3% in December, due in part to unplanned maintenance. An oil spill in Kansas, United States impacted the supply of Canadian crude oil to the Keystone export pipeline in December.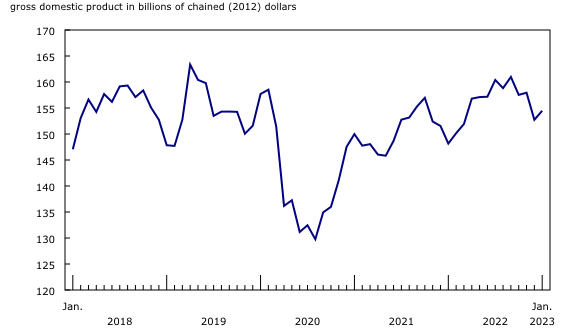
The manufacturing sector grew 0.5% in January, as growth in durable goods manufacturing more than offset a decline in non-durable goods manufacturing.
In January, the construction sector (+0.7%) posted its largest gain since March 2022, reflecting increases in all construction subsectors.
Transportation and warehousing rebounded 1.9% in January, more than offsetting a 1.1% decrease in December which, in part, resulted from bad weather conditions late in the month.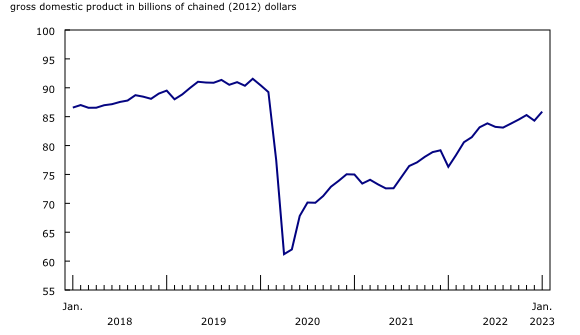
The accommodation and food services sector rose 4.0% in January. Increased activity in the food services and drinking places subsector (+4.9%) contributed significantly to the growth in the sector, as each type of activity saw an increase.
Arts, entertainment and recreation increased 2.1% in January, with the increase solely coming from performing arts, spectator sports, and heritage institutions (+6.8%).
The public sector (educational services, health care and social assistance, and public administration combined) expanded 0.3% in January, up for the 12th consecutive month as all components increased.
Monthly data on gross domestic product (GDP) by industry at basic prices are chained volume estimates with 2012 as the reference year. This means that the data for each industry and each aggregate are obtained from a chained volume index multiplied by the industry's value added in 2012. The monthly data are benchmarked to annually chained Fisher volume indexes of GDP obtained from the constant-price supply and use tables (SUTs) up to the latest SUT year (2019).
With this release of monthly GDP by industry, revisions have been made back to January 2022.
Real-time table 36-10-0491-01 will be updated on April 11, 2023.
Data on GDP by industry for February will be released on April 28.
The User Guide: Canadian System of Macroeconomic Accounts (Catalogue number13-606-G) is available.
For more information, or to enquire about the concepts, methods or data quality of this release, contact us (toll-free 1-800-263-1136; 514-283-8300; infostats@statcan.gc.ca) or Media Relations (statcan.mediahotline-ligneinfomedias.statcan@statcan.gc.ca).
* All content is copyrighted by Industry Intelligence, or the original respective author or source. You may not recirculate, redistrubte or publish the analysis and presentation included in the service without Industry Intelligence's prior written consent. Please review our terms of use.


