OTTAWA
,
May 31, 2023
(press release)
–
Real gross domestic product (GDP) was essentially unchanged in March, following a 0.1% increase in February. Service-producing industries (+0.0%) were flat, whereas goods-producing industries (-0.1%) edged down. Overall, 12 of 20 industrial sectors posted increases in March. Chart 1: Real gross domestic product essentially unchanged in March Mining, quarrying, and oil and gas extraction expands for third consecutive month Chart 2: Mining, quarrying, and oil and gas extraction grows in March Oil sands extraction (+2.0%) contributed the most to the increase, led by higher production in both crude bitumen and synthetic oil production in Alberta, following unplanned production disruptions earlier in the year. Oil and gas extraction (except oil sands) edged down 0.1% in March. Conventional crude oil declines were largely due to lower production in Newfoundland and Labrador. In the west, there were gains in natural gas production to replenishing depleted natural gas storage levels, which partially offset the declines in oil production. Support activities for mining, and oil and gas extraction rose 3.7%, as all forms of support activities were up. Mining and quarrying (except oil and gas) was up 0.3% in March, after alternating between increases and decreases over the last four months. Higher metal ore mining (+2.8%), largely stemming from growth in copper, nickel, lead and zinc ore mining, was tempered by declines in both potash and diamond mining. A diamond mine in the Northwest Territories scheduled to close in 2025 began reducing production. Manufacturing contracts After increasing for two months, durable goods manufacturing declined 1.0% in March, with 7 of 10 subsectors posting declines. Machinery, fabricated metal product and primary metal manufacturing contributed the most to the decrease. Strong growth in miscellaneous manufacturing offset some of the decline. Non-durable goods manufacturing decreased 0.2% in March, down for a second straight month, and four of nine subsectors declined. Chemical and plastics and rubber products manufacturing contributed the most to the decline, while growth in food and petroleum and coal product manufacturing offset some of the decline. Service-producing industries Public sector continues upward momentum Accommodation and food services fall A gain in accommodation services (+4.1%) tempered the overall decline in the sector. Retail and wholesale trade decline for second consecutive month Wholesale trade activity contracted 0.6% in March, its fourth decline in five months, driven by the machinery, equipment and supplies wholesalers (-2.1%) and the miscellaneous wholesalers (-5.3%) subsectors. The decline in the machinery, equipment and supplies subsector reflected a marked decline in computer and communications equipment and supplies, which coincided with a decline in imports of electronic and electrical equipment and parts. Real estate and rental and leasing Rental and leasing services rose 0.5% in March, with automotive equipment rental and leasing increasing 1.2%. As supply chain volatility and semiconductor chip shortages slightly abated in 2023, rental companies were able to increase their fleet sizes after selling most of their vehicles early in the pandemic. Professional, scientific and technical services Chart 3: Main industrial sectors' contribution to the percent change in gross domestic product in March Advance estimate for real gross domestic product for April 2023 Growth accelerates in the first quarter of 2023 The public sector (educational services, health care and social assistance, and public administration combined) (+0.9%), up for the 11th consecutive quarter, led the increase, as all three components recorded growth. The sector was the largest contributor to overall growth for a third quarter in a row. The professional, scientific and technical services sector increased 1.1%, with computer systems design and related services (+1.2%) driving the increase in the sector for an eighth consecutive quarter. The industry expanded at a slower pace than what was observed on average in 2022, which saw the fastest annual growth rate for the industry since 1999. Accommodation and food services was up 3.4% in the quarter, its fourth quarterly increase in a row of growth, as food services and drinking places rose 3.9%. This was the first quarter since the outbreak of the pandemic without any restrictions or health measures targeting the sub-sector. Retail trade increased 1.2% after two consecutive quarterly declines, with motor vehicle and parts dealers (+4.6%) contributing the most to the quarterly expansion. This was the subsector's third consecutive quarterly expansion. Wholesaling of machinery, equipment and supplies (+2.1%) led the growth in the wholesale trade sector (+1.0%) in the quarter, and wholesaling of personal and household goods (+2.7%) further added to the growth. Transportation and warehousing (+1.2%) rose for a fourth consecutive quarter. Rail transportation (+4.6%), the largest contributor to growth in the first quarter, rebounded from declines observed in the second half of 2022, as carloadings of several commodities (coal, iron ore and fertilizers) increased. Air transportation further contributed to the growth, with a 0.8% gain. The manufacturing sector (+1.2%) led the increase in goods-producing industries in the first quarter. Machinery (+8.8%) and transportation equipment (+5.9%) manufacturing were the main contributors to the growth, as exports of passenger vehicles rose in the quarter. Construction (+0.3%) was the only other goods-producing sector to expand in the quarter, driven by increases in engineering and other construction (+4.3%), which rose for a 10th consecutive quarter. Mining, quarrying, and oil and gas extraction (-0.6%) contracted for a second consecutive quarter, as a strong decline in December more than offset increases in the sector from January to March. Support activities for mining, and oil and gas extraction (-4.9%) contributed the most to the quarterly decline. A 0.1% growth in oil and gas extraction was largely offset by lower mining and quarrying (except oil and gas) (-0.1%). Chart 4: Main industrial sectors' contribution to the percent change in gross domestic product, first quarter Note to readers For the period starting in January 2020, data are derived by chaining a fixed-weight Laspeyres volume index to the previous period. The fixed weights are 2019 industry prices. This approach makes the monthly GDP by industry data more comparable with expenditure-based GDP data, which are chained quarterly. All data in this release are seasonally adjusted. For information on seasonal adjustment, see Seasonally adjusted data – Frequently asked questions. An advance estimate of industrial production for April 2023 is available upon request. For more information on GDP, see the video "What is Gross Domestic Product (GDP)?." Revisions Each month, newly available administrative and survey data from various industries in the economy are integrated, resulting in statistical revisions. Updated and revised administrative data (including taxation statistics), new information provided by respondents to industry surveys, data confrontation and reconciliation process and standard changes to seasonal adjustment calculations are incorporated with each release. Real-time table Next release Products The Methodological Guide: Canadian System of Macroeconomic Accounts (Catalogue number13-607-X) is also available. The Economic accounts statistics portal, accessible from the Subjects module of the Statistics Canada website, features an up-to-date portrait of national and provincial economies and their structure. Contact information Industry Intelligence Editor's Note: This press release omits select charts and/or marketing language for editorial clarity. Click here to view the full report.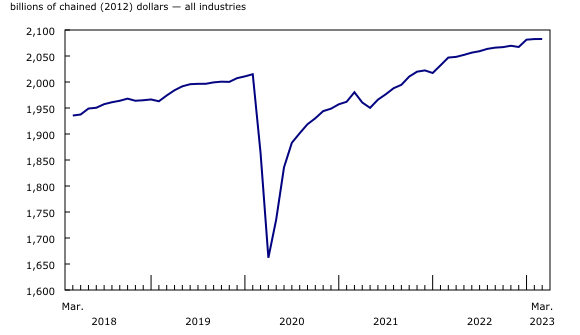
Mining, quarrying, and oil and gas extraction increased 1.2% in March, marking a third consecutive monthly gain, and all subsectors contributed to the growth.
The manufacturing sector contracted 0.6% in March, with declines in both durable and non-durable goods manufacturing.
Service-producing industries were essentially unchanged in March. Overall, 10 sectors increased, notably the public sector as well as real estate and rental and leasing. However, these increases were largely offset by contractions in accommodation and food along with retail and wholesale trade activity.
The public sector (educational services, health care and social assistance, and public administration combined) continued its upward momentum, increasing 0.3% in March and rising continuously since February 2022.
The accommodation and food services sector contracted 2.2% in March, the largest monthly decline since January 2022. Food services and drinking places was the main contributor to the decline, dropping 4.7%, reflecting a decline in sales in the subsector. In March 2023, three years after the declaration of the global pandemic, the subsector remained 7.5% below the pre-COVID-19 pandemic level of activity.
Retail trade declined 0.8% in March due to retail activity declining in 6 of 12 subsectors. Motor vehicle and parts dealers (-5.6%) contributed the most to the decline. The motor vehicle and parts dealers subsector saw its first decline in eight months, with the bulk of the value-added decline coming from new car dealers and other motor vehicle dealers. After gains in the first two months of the year, clothing and clothing accessories stores contracted 1.8% in March, its slowest growth rate since April 2022. Gains in miscellaneous store retailers and building material and garden equipment and supplies dealers partially offset the decline.
The real estate and rental and leasing sector increased 0.3% in March, its fastest growth rate since February 2022. After a 0.8% increase in February 2023, activity at the offices of real estate agents and brokers and activities related to real estate increased 2.8% in March, its first consecutive increase since February 2022. With the Bank of Canada pausing interest rate hikes and prices seemingly moderating, some buyers re-entered the market, as reflected by increases largely concentrated in British Columbia, particularly the Fraser Valley.
In March, the professional, scientific and technical services sector increased 0.2%, its fourth consecutive increase, as seven of the nine industries registered gains. Architectural, engineering and related services and computer systems design and related services contributed the most to the monthly gain, while legal services, which derive a lot of their activity from real estate transactions, rose 0.5%.
Advance information indicates that real GDP increased 0.2% in April. Increases in the mining, quarrying, and oil and gas extraction and transportation and warehousing sectors, as well as in the offices of real estate agents and brokers and the other activities related to real estate industries, were partially offset by decreases in the wholesale and retail trade and public administration sectors. Owing to its preliminary nature, these estimates will be updated on June 30, 2023, with the release of the official GDP data for April.
Real GDP by industry rose 0.7% in the first quarter of 2023, growing at its fastest pace since the second quarter of 2022, when several sectors rebounded from the impact of the Omicron variant. Goods-producing industries edged up 0.1%, partially offsetting the decline observed in the final quarter of 2022. Service-producing industries were up 0.9%, rising for a seventh consecutive quarter. Overall, 16 of 20 sectors recorded gains.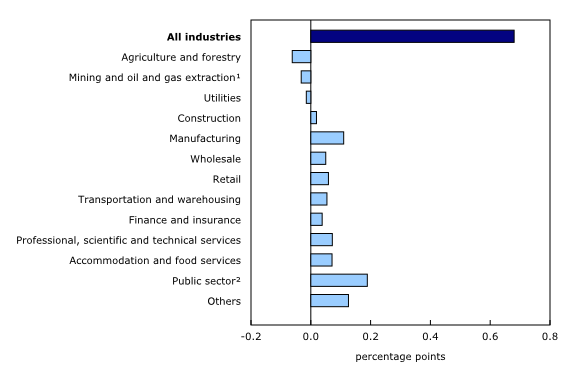
Monthly data on gross domestic product (GDP) by industry at basic prices are chained volume estimates with 2012 as the reference year. This means that the data for each industry and each aggregate are obtained from a chained volume index multiplied by the industry's value added in 2012. The monthly data are benchmarked to annually chained Fisher volume indexes of GDP obtained from the constant-price supply and use tables (SUTs) up to the latest SUT year (2019).
With this release of monthly GDP by industry, revisions have been made back to January 2022.
Real-time table 36-10-0491-01 will be updated on June 14.
Data on GDP by industry for April will be released on June 30.
The User Guide: Canadian System of Macroeconomic Accounts (Catalogue number13-606-G) is available.
For more information, or to enquire about the concepts, methods or data quality of this release, contact us (toll-free 1-800-263-1136; 514-283-8300; infostats@statcan.gc.ca) or Media Relations (statcan.mediahotline-ligneinfomedias.statcan@statcan.gc.ca).
* All content is copyrighted by Industry Intelligence, or the original respective author or source. You may not recirculate, redistrubte or publish the analysis and presentation included in the service without Industry Intelligence's prior written consent. Please review our terms of use.


