OTTAWA
,
September 15, 2022
(press release)
–
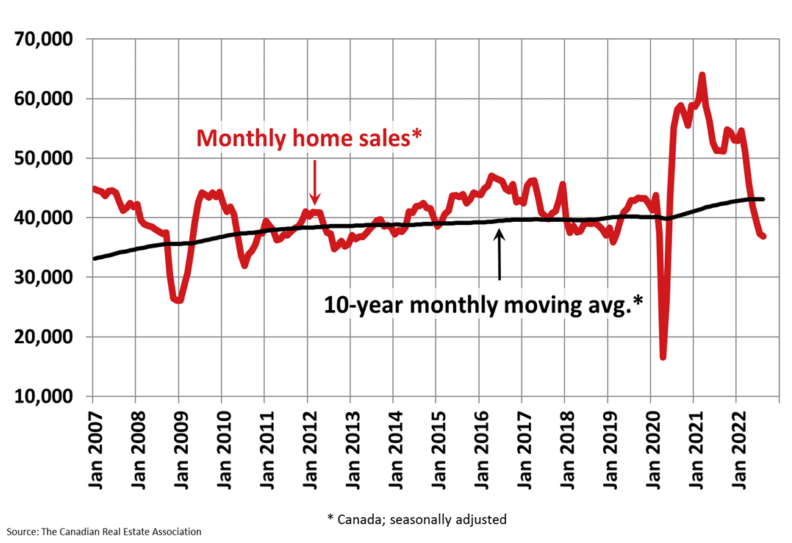
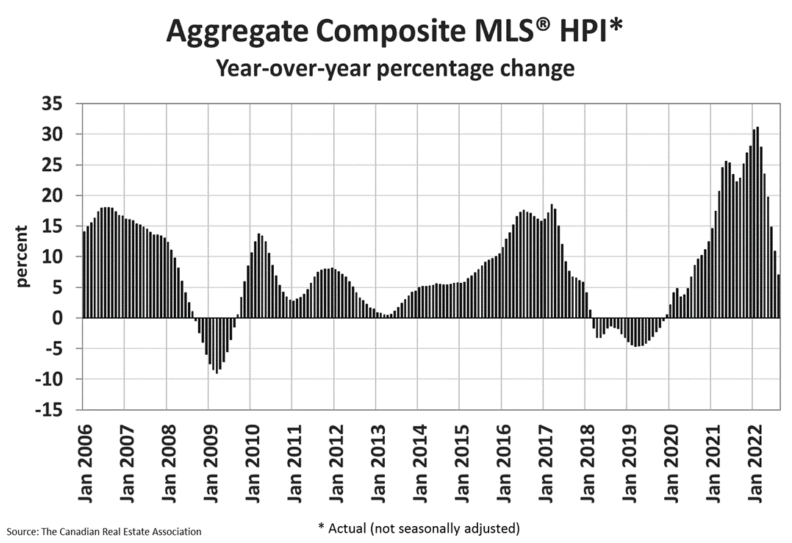
Highlights: Home sales recorded over Canadian MLS® Systems edged down a slight 1% between July and August 2022. While this was the sixth consecutive month-over-month decline in housing activity, it was the smallest of the six as the national sales slowdown triggered by rising interest rates continues to moderate. It was close to an even split between the number of markets where sales were up and those where sales were down. Gains were led by the Greater Toronto Area (GTA) and a large regional mix of other Ontario markets. These were offset by declines in Greater Vancouver, Calgary, Edmonton, Winnipeg, and Halifax-Dartmouth. The actual (not seasonally adjusted) number of transactions in August 2022 came in 24.7% below the same month last year. While still a large decline, it was smaller than the 29.4% year-over-year drop recorded in July. “August saw national sales hold steady month-to-month for the first time since February which, along with a stabilization of demand/supply conditions in many markets, could be an early sign that this year’s sharp adjustment in housing markets across Canada may have mostly run its course,” said Jill Oudil, Chair of CREA. “That said, some buyers may choose to remain on the sidelines until they see clearer signs of borrowing costs and prices also stabilizing. As the market continues to evolve, your best bet is to contact your local REALTOR® for information and guidance about how to navigate this rapidly changing environment,” continued Oudil. “The stress test was unpopular with some when it was introduced. But as we have all now watched the Bank of Canada raise its key interest rate by 300 basis points in the space of five months, it’s clear many Canadians were protected by it,” said Shaun Cathcart, CREA’s Senior Economist. “But should there not be a flipside to the coin? The overnight rate is now officially above the Bank of Canada’s “neutral” range and not expected to go too much higher. This is not about “looser” or “tighter”, it is about what is appropriate given where rates are and where they are likely to go moving forward. OSFI is likely thinking hard about what makes sense given the new realities, and how to balance the community of interests they are tasked with securing.” The number of newly listed homes fell to 5.4% on a month-over-month basis in August. This built on the 5.9% decline noted in July, as some sellers appear content to stay on the sidelines until more buyers are ready to get back into the market. The decline in new supply was broad-based, with listings decreasing in about 80% of local markets, including every large market except for Montreal, where new supply was mostly flat from July to August. With sales little changed and new listings down in August, the sales-to-new listings ratio tightened to 54.5% compared to 52.1% in July. The August 2022 reading for the national sales-to-new listings ratio was very close to its long-term average of 55.1%. There were 3.5 months of inventory on a national basis at the end of August 2022, up slightly from 3.4 months at the end of July. While the number of months of inventory remains well below the long-term average of about five months, it is also up quite a bit from the all-time low of 1.7 months set at the beginning of 2022. The Aggregate Composite MLS® Home Price Index (HPI) edged down 1.6% on a month-over-month basis in August 2022, not a small decline historically, but smaller than in June and July. Breaking it down regionally, most of the monthly declines in recent months have been in markets across Ontario and, to a lesser extent, in British Columbia; however, in August it was Ontario markets that contributed most to the overall national decline. Looking across the Prairies, prices in Alberta appear to have peaked. Prices are still rising slightly in Saskatchewan, while Manitoba recorded the only decline. In Quebec, prices have dipped somewhat in the last couple of months. On the East coast, the softening of prices that had been confined to Halifax-Dartmouth is now also appearing in New Brunswick and Newfoundland and Labrador. By contrast, prices in PEI continue to edge ahead on a month-over-month basis. The non-seasonally adjusted Aggregate Composite MLS® HPI was still up by 7.1% on a year-over-year basis in August. This was the first single digit increase in almost two years, as year-over-year comparisons have been winding down at a brisk pace from the near-30% record year-over-year gains logged just six months ago. The actual (not seasonally adjusted) national average home price was $637,673 in August 2022, down 3.9% from the same month last year. The national average price is heavily influenced by sales in Greater Vancouver and the GTA, two of Canada’s most active and expensive housing markets. Excluding these two markets from the calculation cuts $114,800 from the national average price.
* All content is copyrighted by Industry Intelligence, or the original respective author or source. You may not recirculate, redistrubte or publish the analysis and presentation included in the service without Industry Intelligence's prior written consent. Please review our terms of use.


