OTTAWA
,
May 6, 2022
(press release)
–
Employment was little changed in April after two consecutive months of growth. The unemployment rate edged down 0.1 percentage points to 5.2%. Increases in employment in professional, scientific and technical services and public administration were offset by declines in construction and retail trade. There were more people working in the Atlantic region and Alberta, while employment fell in Quebec. At the national level, employment gains among core-aged women aged 25 to 54 were offset by a decrease among core-age men. Total hours worked fell 1.9% in April, driven in part by absences related to illness or disability. Average hourly wages were up 3.3% (+$0.99 to $31.06) year over year, similar to the growth observed in March (+$1.03; +3.4%). As of the April reference week (April 10 to 16), remaining capacity limits affecting business operations had generally been lifted, although some combination of masking, proof-of-vaccination, or testing remained a requirement in some settings in certain jurisdictions. Chart 1: Employment holds steady in April Highlights The employment rate held steady at 61.9%. Employment rose among core-aged women (+43,000; +0.7%), and declined among core-aged men (-36,000; -0.5%) in April. Employment increased in New Brunswick, Nova Scotia, Newfoundland and Labrador, and Alberta, while it declined in Quebec. Employment gains in professional, scientific and technical services, as well as in public administration, were offset by declines in construction and retail trade. Total hours worked were down 1.9% in April, partly due to an increase in illness-related absences. In April, average hourly wages were up 3.3% (+$0.99 to $31.06) year over year, similar to the growth observed in March (+3.4%; +$1.03). Unemployment rate continues to decline The unemployment rate for people aged 25 to 54 fell 0.2 percentage points to 4.3%, the lowest recorded rate since comparable data became available in 1976. Long-term unemployment accounted for 20.6% of total unemployment in April 2022, up from the pre-pandemic February 2020 level of 15.6%. Employment holds steady after two months of growth Following increases in four of the last six months, full-time employment was little changed in April. The number of Canadians in part-time jobs—that is, who usually work less than 30 hours per week—has followed a less consistent trend over the past six months and rose by 47,000 (+1.3%) in April. A number of signs have pointed to an increasingly tight labour market in recent months. In addition to increases in full-time work, one aspect of this tightening has been a decrease in the proportion of part-time workers reporting that they would prefer full-time employment. The involuntary part-time employment rate fell to 15.7% in April 2022, the lowest level on record. The involuntary part-time rate had been elevated over the first 18 months of the pandemic, and peaked at 26.5% in August 2020, as many workers faced challenges securing full-time employment. The number of public and private sector employees was little changed in April for the second consecutive month. The number of self-employed was unchanged in April and has not shown notable growth since March 2021. Employment gains for core-aged women offset by losses among core-aged men The employment rate for the core-aged population was unchanged for the third consecutive month at 84.6%. The rate for core-aged men fell 0.6 percentage points to 88.0%, while the rate for women rose 0.5 percentage points to 81.2%, similar to the record high observed in February. From April 2021 to April 2022, employment rate increases were seen for many groups within the core-age population, including among Indigenous men (+4.9 percentage points to 78.8%) and women (+5.7 percentage points to 74.0%) living off-reserve. Among core-aged immigrants who landed in Canada in the previous five years, the employment rate was 77.1% in April 2022, up 3.9 percentage points from April 2021 (three-month moving averages, not seasonally adjusted). Employment little changed among youth and older Canadians Among Canadians aged 55 and older, the employment rate was little changed in April at 35.0%, and remained 1.1 percentage points below its February 2020 level. The employment rate for Canadians aged 55 to 64 (63.4%) was on par with its February 2020 level for the third consecutive month. After returning to its pre-pandemic level in February 2022, employment among women aged 55 to 64 was unchanged for the second consecutive month in April. Employment among men in this age group was also little changed in April and has been largely stable since returning to its pre-pandemic level in February 2021. Based on the most recent results from the 2021 Census, people aged 55 to 64 account for more than one-fifth (21.8%) of the working age population, highlighting the importance of this demographic group to the labour market and the economy. Absences due to illness and disability lead to a decline in actual hours worked Excluding people who were absent from work primarily due to the Good Friday holiday or vacation, nearly 1 in 10 employees (9.0%) were absent from work due to illness or disability in April 2022, 2.0 percentage points higher than the April average observed from 2017 to 2019. Although lower than the peak seen during the fifth wave of COVID-19 in January 2022 (10.4%), this proportion was among the highest observed over the course of the pandemic (not seasonally adjusted). In Manitoba, blizzard conditions during the April Labour Force Survey (LFS) reference week also contributed to a decline in hours worked in April, with 13.8% (81,000) of employees reporting absences due to severe weather (not seasonally adjusted). Unemployment rate remains at record low The labour underutilization rate, which includes people who worked less than half their usual hours for reasons most likely connected to pandemic labour market disruptions, rose 0.8 percentage points in April. Increased absences due to personal illness or disability contributed to more employed people working less than half their usual hours (+176,000; +17.2%). Chart 2: Unemployment rate continues on downward trend Unemployment rate for those aged 25 to 54 continues to fall, driven by core-age women The decline was led by core-age women, among whom the number of unemployed fell by 30,000 (-9.5%), and for whom the unemployment rate dropped 0.5 percentage points to 4.4%. Their participation rate inched up to an all-time high of 84.9% in April, similar to the previous high in March (84.8%). For core-age men, the unemployment rate was unchanged in April, remaining at an all-time low of 4.1%. Participation for core-age men was down 0.5 percentage points to 91.8%, after reaching an all-time high in March 2022. Unemployment rises for male youth, as more enter the labour market The unemployment rate for female youth (8.6%) was little changed for the second consecutive month, and their participation rate was 65.6%, a decline of 1.1 percentage points from March 2022. The current level of youth participation in the labour market (65.1% in April) is similar to the average observed from 2017 to 2019 (64.6%), but below the level recorded in 2008 (67.9%), before the 2008/2009 recession. After that recession, youth participation in the labour force declined, and has yet to fully recover, particularly among teenagers. For youth, including international students, decisions to participate in the labour market can be related to school enrolment, as well as other socioeconomic and cultural factors, which may vary across population groups. For example, just over half (55.4%) of visible minority youth were participating in the labour force in April, ranging from 40.3% among West Asian Canadian youth to 68.3% among Filipino Canadian youth. In comparison, the participation rate among youth who did not identify as a visible minority was 64.5% (three-month moving averages, not seasonally adjusted). In this context, youth may represent one source of labour supply that could help ease current labour market tightness. According to the latest Job Vacancy and Wage Survey, job vacancies in accommodation and food services and in retail trade—industries which typically employ a large proportion of youth—accounted for one-quarter (23.6%) of all job vacancies in February 2022 (not seasonally adjusted). Unemployment rate little changed for older men and women The unemployment rate among women aged 55 to 64 fell 0.6 percentage points in April to 4.4%, while the rate for men (5.5%) was little changed. Among women aged 55 to 64, the participation rate fell 0.8 percentage points in April to 60.7%, while for men it was little changed at 72.9%. These rates are on par with those observed in 2019. The most recent results from the 2021 Census found that Canada faces record retirements, with more than 1 in 5 (21.8%) people of working age being aged 55 to 64. In the coming years, particularly in the context of tight labour market conditions, the labour force participation rate of this age group may be a key factor in balancing labour supply and demand. Long-term unemployment little changed in April The ability of the long-term unemployed to transition to employment may be influenced by a number of factors, including their level of education. For example, among the long-term unemployed in April, more than 1 in 4 (27.6%) had completed a bachelor's degree or higher, compared with 20.7% among people who had been unemployed less than 27 weeks (three-month moving averages, not seasonally adjusted). This may be an indication of some degree of mismatch between the long-term unemployed and the jobs they see as available to them, despite the tight labour market. Employment holds steady in both the services- and goods-producing sectors Employment in professional, scientific and technical services increases faster than total employment Since April 2021, the majority (57.2%) of the net increase in employees in the industry has been among those with a bachelor's degree or higher (+70,000; +9.8%) (not seasonally adjusted). Chart 3: Employment growth in professional, scientific and technical services outpaces total employment growth in the past year Employment in public administration increases for second consecutive month Employment in retail trade down for the first time since January 2022 Employment in construction decreases after four months of growth Employment rises in the Atlantic region and Alberta, falls in Quebec Nova Scotia (+5,900; +1.2%) and Newfoundland and Labrador (+2,500; +1.1%) also recorded employment gains in April. Both provinces also recorded unemployment rate declines (-2.1 percentage points to 10.8% in Newfoundland and Labrador; -0.5 percentage points to 6.0% in Nova Scotia). In Alberta, employment climbed by 16,000 (+0.7%) in April, the first notable increase since December 2021. Employment gains were largely in wholesale and retail trade. The unemployment rate fell 0.6 percentage points to 5.9%. Despite the provincial rate dropping in April, Calgary (7.2%) and Edmonton (6.9%) were among the census metropolitan areas (CMAs) with the highest unemployment rates (three-month moving averages). After increasing in February and March, employment declined by 27,000 (-0.6%) in Quebec in April, entirely in full-time work and driven by declines in construction and educational services. The unemployment rate was little changed (3.9%) and remained at a record low. Despite declining 0.7 percentage points to 89.5% in April, the proportion of 25-to-54 year-olds participating in the labour market in the province remained above the national rate for people in this age group (88.4%). In April, both employment and the unemployment rate (5.4%) were little changed in Ontario. Employment was also little changed in all other provinces. For further information on key province and industry level labour market indicators, see "Labour Force Survey in brief: Interactive app." Spotlights The most recent results from the Job Vacancy and Wage Survey suggest that this three-year drop in the number of employees earning less than $20.00 per hour is the result of decreased labour supply—fewer workers available and willing to work for lower wages—rather than a drop in demand. Job Vacancy and Wage Survey results show that, as of the fourth quarter of 2021, the number of vacant jobs in occupations where the average offered hourly wage is less than $20.00 was 166,000 (+61.4%) higher than in the first quarter of 2019 (not seasonally adjusted). In contrast to the situation for those earning less than $20.00 per hour, the number of employees earning $40.00 or more per hour was up by 1.2 million (+42.7%) in April 2022 compared with April 2019. This group represented almost one-quarter (24.5%) of employees, up from 18.0% three years earlier. Highlighting the complexity of comparing wage levels across time, the three-year increase in the proportion of employees earning $40.00 or more per hour is attributable to a range of factors. These include wage growth; workers finding higher-paid jobs; and some self-employed workers in higher-wage industries such as professional, scientific and technical services becoming employees. Chart 4: Average hourly wage distribution suggests lasting shift in the composition of employment Working from home varies widely in Canada's big cities In April, 19.0% of workers usually worked exclusively from home, down from 24.3% in January. Prior to April, the percentage of workers who reported having a hybrid work arrangement—that is, they usually work both at home and at locations other than home—had been increasing, suggesting that at least some workers were making use of hybrid arrangements to gradually transition back to in-person work. In April, the share of workers reporting hybrid arrangements held steady at 5.8% (population aged 15 to 69; not seasonally adjusted). The future of working from home and hybrid work is of concern to many cities, as it may impact transit, zoning, and other areas of interest to municipal authorities. The share of employees working at home—either exclusively or through a hybrid arrangement—varies considerably across Canada's CMAs. As of April, 45.8% of workers living in the Ontario part of the Ottawa–Gatineau CMA were working either partly or exclusively from home. Working from home was also notably high in the Quebec part of that CMA (39.4%), as well as in the Toronto (35.1%) and Québec (32.9%) CMAs. On the other hand, workers in the Abbotsford–Mission (13.9%) and Lethbridge (15.0%) CMAs were among the least likely to usually work entirely or partly from home (population aged 15 to 69; three-month moving averages; not seasonally adjusted). These differences are partly explained by differences in the composition of employment by industry across cities. For example, in April, 2 in 5 (39.4%) workers in the Ottawa–Gatineau CMA and more than one-quarter (28.4%) in the Toronto CMA worked in one of the three industries with the highest shares of workers working from home: professional, scientific and technical services; finance, insurance, real estate, rental and leasing; and public administration. In comparison, in the Abbotsford–Mission CMA these three industries accounted for 14.2% of employment, while 27.2% of workers were employed in the goods-producing sector, where working from home is generally less feasible (three-month moving averages; not seasonally adjusted). Chart 5: Share of workers working from home varies across cities Teleworkers have greater flexibility than other workers managing their daily schedule New LFS questions collected in April suggest that teleworking among employees aged 15 to 69 is associated with a greater ability to balance competing work and personal responsibilities. For example, nearly 9 in 10 (87.8%) teleworkers who worked exclusively at home reported that it was easy or very easy for them to adjust their daily schedule by taking an hour or two during their working hours for personal or family reasons. The share of employees with this flexibility was also high among those with a hybrid work arrangement (83.6%), but was lower among employees who usually work exclusively at a location other than home (61.1%). The ability to balance responsibilities may also be influenced by work schedules. A large majority of employees who telework from home (92.6%) or have hybrid arrangements (91.0%) usually work regular daytime hours or a regular daytime shift. In contrast, among those working at locations other than home, fewer than three-quarters (73.0%) have regular daytime hours, with the remainder working evenings, nights, or maintaining irregular hours or other types of schedules. Despite the greater flexibility offered by teleworking from home and the higher prevalence of regular daytime hours, in April teleworkers were about as likely (31.5%) as employees working exclusively outside the home (29.7%) to indicate that they had sometimes, often, or always found it difficult to fulfill their family responsibilities because of the amount of time they spent working. This may reflect different factors, such as the challenge of maintaining a separation between work and home in the context of remote work and the higher proportion of teleworkers who are in occupations with a relatively low share of part-time work, such as natural and applied sciences and related occupations, and management. In May, Statistics Canada will continue to measure ongoing changes in the locations where Canadians work by collecting data on the ability of workers to choose their work location on a daily, weekly, or occasional basis. LFS data for the week of May 15 to 21 will be released on June 10, 2022. Note to readers The LFS estimates are based on a sample and are therefore subject to sampling variability. As a result, monthly estimates will show more variability than trends observed over longer time periods. For more information, see "Interpreting Monthly Changes in Employment from the Labour Force Survey." This analysis focuses on differences between estimates that are statistically significant at the 68% confidence level. LFS estimates at the Canada level do not include the territories. The LFS estimates are the first in a series of labour market indicators released by Statistics Canada, which includes indicators from programs such as the Survey of Employment, Payrolls and Hours (SEPH); Employment Insurance Statistics; and the Job Vacancy and Wage Survey. For more information on the conceptual differences between employment measures from the LFS and those from the SEPH, refer to section 8 of the Guide to the Labour Force Survey (Catalogue number71-543-G). Since March 2020, all LFS face-to-face interviews have been replaced by telephone interviews conducted by interviewers working from their home to protect the health of both respondents and interviewers. While this has resulted in a decline in the LFS response rate, more than 49,000 interviews were completed in April and in-depth data quality evaluations conducted each month confirm that the LFS continues to produce an accurate portrait of Canada's labour market. The suspension of face-to-face interviewing has had a larger impact on response rates in Nunavut than in other jurisdictions. Due to the larger decline in response rates for Nunavut, and resulting changes in the composition of the responding sample, data for Nunavut (table 14-10-0292-01) should be used with caution. To reduce the risks associated with declining data quality for Nunavut, users are advised to use 12-month averages (available upon request) rather than 3-month averages when possible. Statistics Canada will continue to monitor the quality of LFS data for Nunavut each month and provide users with updated guidelines as required. The employment rate is the number of employed people as a percentage of the population aged 15 and older. The rate for a particular group (for example, youths aged 15 to 24) is the number employed in that group as a percentage of the population for that group. The unemployment rate is the number of unemployed people as a percentage of the labour force (employed and unemployed). The participation rate is the number of employed and unemployed people as a percentage of the population aged 15 and older. Full-time employment consists of persons who usually work 30 hours or more per week at their main or only job. Part-time employment consists of persons who usually work less than 30 hours per week at their main or only job. Total hours worked refers to the number of hours actually worked at the main job by the respondent during the reference week, including paid and unpaid hours. These hours reflect temporary decreases or increases in work hours (for example, hours lost due to illness, vacation, holidays or weather; or more hours worked due to overtime). In general, month-to-month or year-to-year changes in the number of people employed in an age group reflect the net effect of two factors: (1) the number of people who changed employment status between reference periods, and (2) the number of employed people who entered or left the age group (including through aging, death or migration) between reference periods. Supplementary indicators used in the April 2022 analysis Employed, worked less than half of their usual hours includes both employees and self-employed, where only employees were asked to provide a reason for the absence. This excludes reasons for absence such as 'vacation,' 'labour dispute,' 'maternity,' 'holiday,' and 'weather.' Also excludes those who were away all week. Not in labour force but wanted work includes persons who were neither employed, nor unemployed during the reference period and wanted work, but did not search for reasons such as 'waiting for recall (to former job),' 'waiting for replies from employers,' 'believes no work available (in area, or suited to skills),' 'long-term future start,' and 'other.' Unemployed, job searchers were without work, but had looked for work in the past four weeks ending with the reference period and were available for work. Unemployed, temporary layoff or future starts were on temporary layoff due to business conditions, with an expectation of recall, and were available for work; or were without work, but had a job to start within four weeks from the reference period and were available for work (don't need to have looked for work during the four weeks ending with the reference week). Labour underutilization rate (specific definition to measure the COVID-19 impact) combines all those who were unemployed with those who were not in the labour force but wanted a job and did not look for one; as well as those who remained employed but lost all or the majority of their usual work hours for reasons likely related to COVID-19 as a proportion of the potential labour force. Potential labour force (specific definition to measure the impact of COVID-19) includes people in the labour force (all employed and unemployed people), and people not in the labour force who wanted a job but didn't search for reasons such as 'waiting for recall (to former job),' 'waiting for replies from employers,' 'believes no work available (in area, or suited to skills),' 'long-term future start,' and 'other.' Information on population groups Seasonal adjustment The seasonally adjusted data for retail trade and wholesale trade industries presented here are not published in other public LFS tables. A seasonally adjusted series is published for the combined industry classification (wholesale and retail trade). Next release Products The product "Labour Force Survey in brief: Interactive app" (Catalogue number14200001) is also available. This interactive visualization application provides seasonally adjusted estimates by province, sex, age group and industry. The product "Labour Market Indicators, by province and census metropolitan area, seasonally adjusted" (Catalogue number71-607-X) is also available. This interactive dashboard provides customizable access to key labour market indicators. The product "Labour Market Indicators, by province, territory and economic region, unadjusted for seasonality" (Catalogue number71-607-X) is also available. This dynamic web application provides access to labour market indicators for Canada, province, territory and economic region. The product Labour Force Survey: Public Use Microdata File (Catalogue number71M0001X) is also available. This public use microdata file contains non-aggregated data for a wide variety of variables collected from the Labour Force Survey. The data have been modified to ensure that no individual or business is directly or indirectly identified. This product is for users who prefer to do their own analysis by focusing on specific subgroups in the population or by cross-classifying variables that are not in our catalogued products. Contact information Industry Intelligence Editor's Note: This press release omits select charts and/or marketing language for editorial clarity. Click here to view the full report.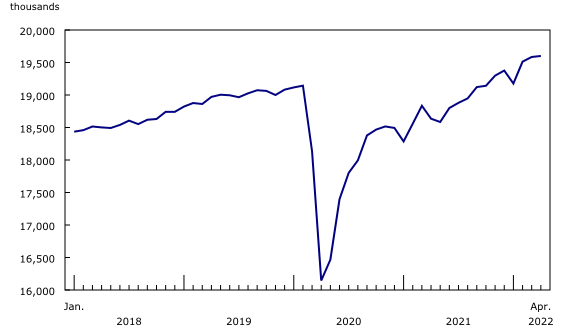
Employment holds steady in April
Employment was little changed in April 2022, after two consecutive months of growth.
After reaching a record low of 5.3% in March, the unemployment rate edged down 0.1 percentage points to 5.2% in April.
Employment was little changed in April, after growing by 409,000 (+2.1%) over February and March, following the losses in January during the fifth wave of COVID-19. The employment rate—the proportion of the population that is employed—was unchanged at 61.9%.
Employment among women aged 25 to 54 grew by 43,000 (+0.7%) in April, with all gains in part-time work. This was offset by a decline in employment among core-aged men (-36,000; -0.5%) in April, primarily in part-time work (-25,000; -6.5%).
Employment among youth aged 15 to 24 held steady in April for the second consecutive month. Part-time employment among young men (+19,000; +3.5%) was the only part of youth employment showing any notable change from March.
As a sixth wave of COVID-19 peaked in many provinces in April, total hours worked fell 1.9% compared with March, driven in part by a spike in illness-related absences from work.
After reaching a record low of 5.3% in March, the unemployment rate edged down a further 0.1 percentage points to 5.2% in April. The adjusted unemployment rate—which includes people who wanted a job, but did not look for one—was 7.2% in April, below the pre-pandemic level of 7.4%.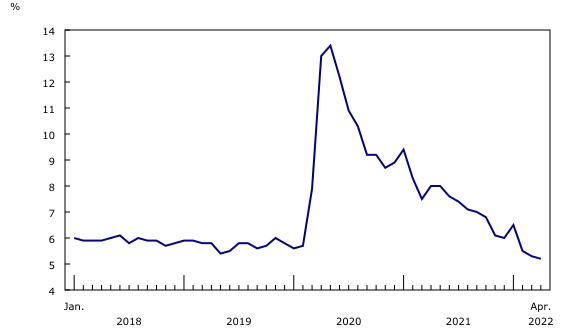
Amid elevated labour demand, recent labour market tightness has been characterized by record low unemployment rates, and record high labour force participation among those in the core working ages of 25 to 54. The unemployment rate for core-aged workers fell 0.2 percentage points to 4.3% in April, the lowest recorded rate since comparable data became available in 1976, and similar to the previous low of 4.4% in February 2022.
Unemployment among male youth aged 15 to 24 rose by 22,000 (+15.0%) in April, and their unemployment rate rose 1.3 percentage points to 11.5%. This was driven by more male youth in the labour market, with their participation rate up 1.3 percentage points to 64.7%, reversing the decline seen in March.
Among Canadians aged 55 and older, the unemployment rates for women (4.5%) and men (5.5%) were little changed in April. Similarly, labour force participation held steady among both women (31.6%) and men (43.5%) in this age group.
Long-term unemployment accounted for one-fifth (20.6%) of total unemployment in April. This remains elevated from the pre-pandemic February 2020 level of 15.6%. There were 224,000 people who had been continuously searching for work or on temporary layoff for 27 weeks or more in April 2022, little changed from March. Among them, two-thirds (66.3%; 149,000) had been unemployed for one year or more.
Employment was virtually unchanged in both the goods-producing and services-producing sectors in April, although there were some movements in specific industries.
The number of people working in professional, scientific and technical services increased by 15,000 (+0.9%) in April. Since April 2021, employment growth in this industry (+121,000; +7.3%) has outpaced total employment growth (+965,000; +5.2%). Growth in this industry was driven by an increase in the number of employees (+122,000; +10.5%), while the number of self-employed workers in the industry was little changed from a year earlier (not seasonally adjusted).
After rebounding from February losses in March, employment increased by a further 17,000 (+1.5%) in public administration in April, notably in Quebec (+6,700; +2.5%). This industry includes those working for federal, provincial, territorial, local, and Indigenous governments, as well as employees of courts and protective services.
Following two months of increases, the number of people working in retail trade fell by 22,000 (-0.9%) in April on a seasonally adjusted basis. Most of the employment losses occurred among Canadians who belong to population groups designated as visible minorities (not seasonally adjusted).
The construction industry had driven the employment gains in the goods-producing sector in recent months. However, following four consecutive months of increases, the number of people working in construction decreased by 21,000 (-1.3%) in April, on a seasonally adjusted basis. The majority of the decrease occurred in Quebec (-16,000; -5.4%).
The number of people working in New Brunswick increased by 6,700 (+1.8%) in April, surpassing its pre-COVID February 2020 level for the first time. The unemployment rate in the province fell by 0.7 percentage points to 9.1%.
Nearly one in four employees now earns $40.00 or more per hour
At the onset of the pandemic, there was a sudden shift in the distribution of employment by wage level, as a result of the unprecedented employment impacts of the initial economic shutdown. Recent results from the LFS indicate that this change in the wage distribution has persisted. As of April, there were 1.3 million (-23.4%) fewer employees with hourly wages of less than $20.00 (in current dollars) compared with April 2019. This group of workers accounted for just over one-quarter of all employees (25.9%) in April 2022, down from more than one-third (35.5%) in April 2019 (not seasonally adjusted).
Over the course of the COVID-19 pandemic, a large number of businesses and organizations responded to public health restrictions by operating remotely. However, in recent months, as remaining public health-related capacity limits in businesses and workplaces were lifted, fewer Canadians have reported working from home.
While remote and hybrid work has provided some benefits to workers seeking to balance work and family responsibilities, it has also generated new challenges. For teleworkers—people working from home who are employees and who use electronic devices to work remotely—these challenges may include managing frequent electronic communications and household responsibilities within the same physical space.
The Labour Force Survey (LFS) estimates for April are for the week of April 10 to 16, 2022.
Employed, worked zero hours includes employees and self-employed who were absent from work all week, but excludes people who have been away for reasons such as 'vacation,' 'maternity,' 'seasonal business,' and 'labour dispute.'
A new data table (14-10-0373-01) presenting labour force characteristics of population groups designated as visible minorities, i.e., South Asian, Chinese, Black, Filipino, Arab, Latin American, Southeast Asian, West Asian, Korean, and Japanese, is now available on the Statistics Canada website.
Unless otherwise stated, this release presents seasonally adjusted estimates, which facilitate comparisons by removing the effects of seasonal variations. For more information on seasonal adjustment, see Seasonally adjusted data – Frequently asked questions.
The next release of the LFS will be on June 10, 2022. May data will reflect labour market conditions during the week of May 15 to 21, 2022.
More information about the concepts and use of the Labour Force Survey is available online in the Guide to the Labour Force Survey (Catalogue number71-543-G).
For more information, or to enquire about the concepts, methods or data quality of this release, contact us (toll-free 1-800-263-1136; 514-283-8300; infostats@statcan.gc.ca) or Media Relations (statcan.mediahotline-ligneinfomedias.statcan@statcan.gc.ca).
* All content is copyrighted by Industry Intelligence, or the original respective author or source. You may not recirculate, redistrubte or publish the analysis and presentation included in the service without Industry Intelligence's prior written consent. Please review our terms of use.


