OTTAWA
,
July 5, 2022
(press release)
–
The total value of building permits in Canada rose 2.3% in May to $12.1 billion. The non-residential sector increased 7.0% to $4.3 billion, while the residential sector edged down 0.1% to $7.8 billion. On a constant dollar basis (2012=100), the total value of building permits increased 1.8% to $7.7 billion. Chart 1: Total value of building permits, seasonally adjusted Infographic 1: Building permits, May 2022 Multi and single residential construction diverges Construction intentions in the multi-family component decreased 5.9% in May, with Quebec returning to more normal levels. Conversely, British Columbia saw a 10.1% increase in part due to a $112 million permit for a condo building in Surrey. Single-family homes have continued their comeback since the COVID-19 pandemic downturn and longer-term secular decline, increasing 7.0% in total value nationally this month. Overall, the number of new units created decreased 3.4% compared with April. The decline in the multi-family component (-6.4%) was partially offset by the increase in the single-family home component (+5.4%). Chart 2: Value of building permits for the single-family and multi-family components Chart 3: Value of building permits for the residential and non-residential sectors British Columbia pushes up non-residential sector Commercial permit values increased sharply by 15.6% in May, driven by British Columbia with an overall increase of 73.8% for the month. Construction intentions in the institutional component rose 4.3% in May. Gains were led by British Columbia (+54.9%), reflecting an $82 million permit for a hospital in Fort St. James. New Brunswick also saw notable gains due to permits for a police station and a school in Moncton. Conversely, gains were largely countered by decreases in Quebec (-20.2%) and Ontario (-8.1%). To explore data using an interactive user interface, visit the Building permits: Interactive Dashboard. To explore the impact of the pandemic on the socioeconomic landscape, please consult the Canadian Economic Dashboard and COVID-19. For more information on housing, please visit the Housing statistics portal. Statistics Canada has a Housing Market Indicators dashboard. This web application provides access to key housing market indicators for Canada, by province and by census metropolitan area. These indicators are updated automatically with new information from monthly releases, giving users access to the latest data. Note to readers Building components Revision For information on trend-cycle data, see the StatCan Blog and Trend-cycle estimates – Frequently asked questions. Next release Contact information Industry Intelligence Editor's Note: This press release omits select charts and/or marketing language for editorial clarity. Click here to view the full report.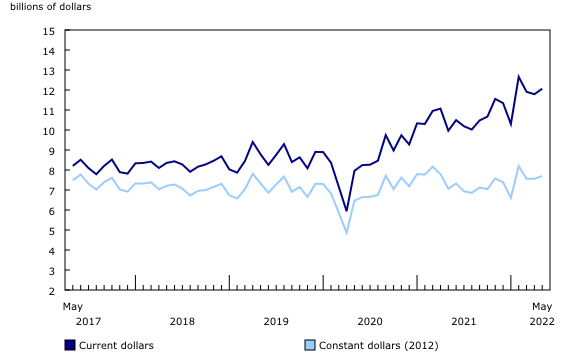
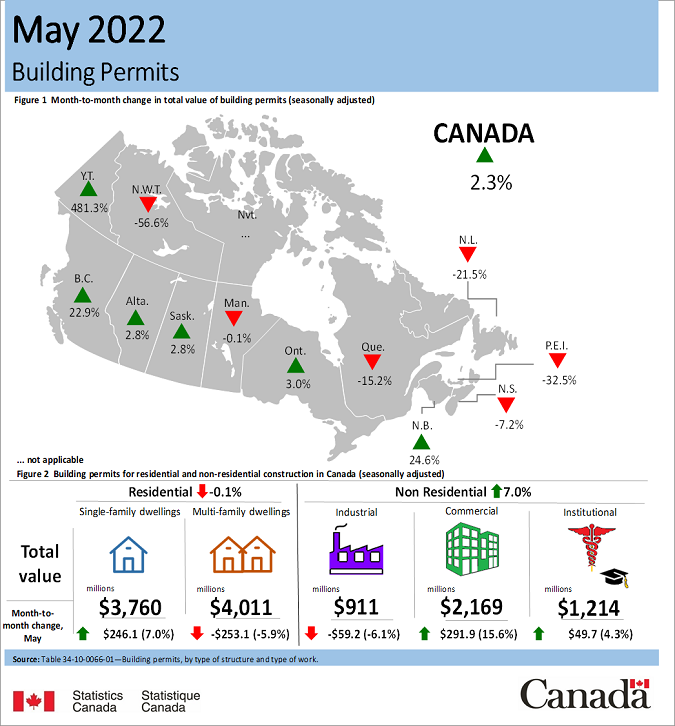
Residential permits edged down 0.1% to $7.8 billion in May. Increases in Ontario and British Columbia were offset by losses in seven other provinces.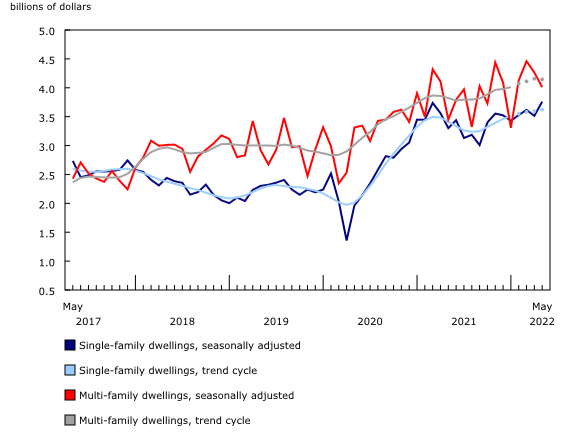

The total value of non-residential sector permits increased 7.0% to $4.3 billion in May. Gains in the commercial and institutional sectors outweighed losses in the industrial component, which declined 6.1%.
Unless otherwise stated, this release presents seasonally adjusted data with current dollar values, which facilitate month-to-month and quarter-to-quarter comparisons by removing the effects of seasonal variations. For information on seasonal adjustment, see Seasonally adjusted data – Frequently asked questions.
Data are subject to revisions based on late responses, methodological changes and classification updates. Unadjusted data has been revised for the previous four months to incorporate new municipalities from the 2021 census of population. Seasonally adjusted data has been revised for the same time period.
Data on building permits for June will be released on August 4.
For more information, or to enquire about the concepts, methods or data quality of this release, contact us (toll-free 1-800-263-1136; 514-283-8300; infostats@statcan.gc.ca) or Media Relations (statcan.mediahotline-ligneinfomedias.statcan@statcan.gc.ca).
* All content is copyrighted by Industry Intelligence, or the original respective author or source. You may not recirculate, redistrubte or publish the analysis and presentation included in the service without Industry Intelligence's prior written consent. Please review our terms of use.


