OTTAWA
,
January 19, 2022
(press release)
–
Wholesale sales rise for a fourth consecutive month Constant dollar sales increased 3.1% in November. Chart 1: Wholesale sales rise in November Building materials and supplies lead gains Miscellaneous wholesaler sales grew 5.0% to $11.3 billion in November, on the strength of increases in the agricultural supplies (e.g., feed and seed), and the chemical and allied product industries. Sales hit an all-time high in November 2021, and were 29.3% higher than in November 2020. The increases partially reflected ongoing demand for Canadian potash abroad, as exports of potash rose 9.7% in November 2021. Motor vehicle and motor vehicle parts and accessories sales rose 4.5% in November to $11.4 billion. It was the second consecutive monthly increase in the subsector, reaching the highest level since February 2020, which was before the pandemic. Many motor vehicle assembly plants across North America expanded production in November, as some semi-conductor chips were received. British Columbia flooding Overall, it is estimated that, nationally, the flooding caused approximately $600 million of loss in wholesale sales. The hardest hit industries were the agricultural supplies industry which reported $105 million in lost sales, and the lumber, millwork and other building supplies industry, which reported $85 million in lost sales. However, lost sales were not the largest impact of the flooding. The significant majority of respondents affected by the storms indicated that logistical and shipping issues were the major concern. As such, delayed sales, delayed shipments, reduced access to raw materials and increased costs for shipping via air cargo were the main effects of the inundation. Higher sales in seven provinces Alberta recorded its largest monthly increase on record, with a 12.1% jump in sales to $8.3 billion, which was also the highest level ever. The machinery, equipment and supplies subsector led the increase, up 16.2% to $2.5 billion, as wholesalers of construction, forestry, mining and industrial machinery, equipment and supplies reported a 25.2% increase in sales. Together with higher sales in the food, beverage and tobacco (+14.9%), and building material and supplies (+13.3%) subsectors, the three subsectors accounted for 86% of the province's monthly increase. Farm product wholesalers reported the only decrease, down 4.0% to $138.9 million. Manitoba and Saskatchewan also saw record sales in November. The growth in the Prairie provinces reflected the strength of the energy product sector and high commodity prices for items such as chemical fertilizer and potash. Sales in Ontario rose for the fifth consecutive month, up 2.2% to $38.2 billion in November. The increase was led by the building material and supplies subsector, up 7.7% to $5.2 billion, closely followed by the motor vehicle and motor vehicle parts and accessories subsector (+4.8%), and the miscellaneous subsector (+6.3%). The gains in these three subsectors totalled $1.0 billion, which was dampened by a 3.8% fall in sales of food, beverage and tobacco. Notwithstanding decreased sales in three of seven subsectors, sales in Ontario were also the highest on record. In Quebec, sales rose 4.7% to $14.6 billion in November. The largest gain came from the building material and supplies subsector, up 13.2% to $2.6 billion, which accounted for 46% of Quebec's increase. All component industries of the subsector had higher sales; however, nearly half was because of a 28.4% increase in metal service centre sales. Value of inventories continues to climb Five of seven subsectors had larger inventories at the end of November; they comprised 89% of the value of inventories in the sector. Inventories in the personal and household goods subsector grew 11.2% to $17.9 billion. All component inventories were larger in November, but the increase was driven by pharmaceuticals and pharmacy supplies, which accounted for 72% of the change and 45% of inventories in the subsector. Pharmaceuticals and pharmacy supplies wholesalers carried $1.3 billion more in inventories at the end of November. Canada imported $1.2 billion more pharmaceuticals and medical products in November than October. Building material and supplies merchant wholesalers reported a 7.7% increase in the value of their inventories, which stood at $19.7 billion at the end of the month. Inventories in all component industries grew, but the inventories of metal service centres grew the most, up 18.8% to $6.1 billion. The contribution of metal service centres accounted for roughly two-thirds of the change in the subsector, despite comprising approximately one-third of the value of its inventories. Farm product wholesalers' and food, beverage and tobacco merchant wholesalers' inventories decreased 0.8% and 0.4%, respectively. The inventory-to-sales ratio increased from 1.36 to 1.37 in November. This ratio is a measure of the time (in months) required to exhaust inventories if sales were to remain at their levels. Note to readers Seasonally adjusted data are data that have been modified to eliminate the effect of seasonal and calendar influences to allow for more meaningful comparisons of economic conditions from period to period. For more information on seasonal adjustment, see Seasonally adjusted data – Frequently asked questions. Trend-cycle estimates are included in selected charts as a complement to the seasonally adjusted series. These data represent a smoothed version of the Seasonally adjusted time series and provide information on longer-term movements, including changes in direction underlying the series. For information on trend-cycle data, see Trend-cycle estimates – Frequently asked questions. Both seasonally adjusted data and trend-cycle estimates are subject to revision as additional observations become available. These revisions could be large and could even lead to a reversal of movement, especially for reference months near the end of the series or during periods of economic disruptions. Total wholesale sales expressed in volume are calculated by deflating current dollar values using relevant price indexes. The wholesale sales series in chained (2012) dollars is a chained Fisher volume index, with 2012 as the reference year. For more information, see Deflation of wholesale sales. The Monthly Wholesale Trade Survey covers all industries within the wholesale trade sector, as defined by the North American Industry Classification System (NAICS), with the exception of oilseed and grain merchant wholesalers (NAICS 41112), petroleum and petroleum products merchant wholesalers (NAICS 412) and business-to-business electronic markets, and agents and brokers (NAICS 419). Real-time data tables Next release Products The product "Monthly Wholesale Trade Survey: Interactive Tool" (Catalogue number71-607-X) is available online. This product is based on the data published in the tables of the Monthly Wholesale Trade Survey: 20-10-0074-01, 20-10-0076-01 and 20-10-0003-01. Contact information Industry Intelligence Editor's Note: This press release omits select charts and/or marketing language for editorial clarity. Click here to view the full report.
Wholesale sales rose 3.5% in November to $75.6 billion, the fourth consecutive monthly increase. Sales increased in six of the seven subsectors, representing nearly 99% of total wholesale sales. The largest increases came in the building materials and supplies, and miscellaneous products subsectors. The growth came despite the impact of severe flooding and transportation disruptions in British Columbia in November.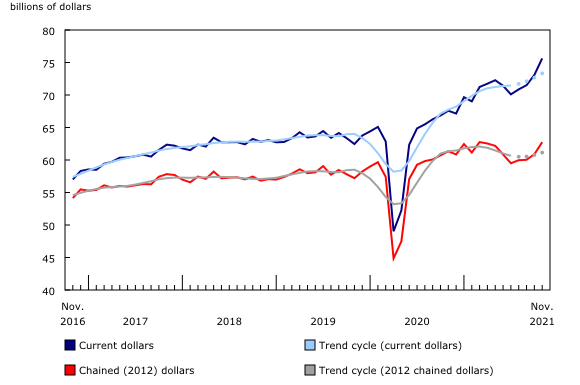
Sales of building materials and supplies rose 7.1% in November to $12.3 billion, reflecting gains in the lumber, millwork, hardware and other building supplies industry, and the metal service centres industry. This was the third increase in the past four months, and sales in November 2021 were 20.7% higher than November 2020. The higher sales throughout 2021 in the building material and supplies subsector were supported by continued strong demand for new home builds and renovations. Cumulative home starts in 2021 from January to November were 28.5% higher than in the same period in 2020. And home renovation spending from January to November 2021 was 29.8% higher than in the same period in 2020.
During the collection of data for November 2021, the Monthly Wholesale Trade Survey asked all survey respondents questions regarding the impact of the major storms and flooding that hit British Columbia in November. The data below provide an assessment of the impact of the flooding on Canadian wholesale sales.
Sales increased in seven provinces and two territories in November, accounting for 98% of total wholesale sales. Alberta, Ontario and Quebec led the gains.
The value of wholesale inventories expanded 4.3% to $103.5 billion in November. This was the seventh consecutive month of growth, and a new high for inventories, which crossed the 100-billion mark for the first time on record.
All data in this release are seasonally adjusted and expressed in current dollars, unless otherwise noted.
Real-time data tables 20-10-0019-01, 20-10-0020-01 and 20-10-0005-01 will be updated soon.
Wholesale trade data for December 2021 will be released on February 16, 2022.
Please note that the tables available on the website represent a subset of the data available with this release. The full dataset is available upon request by contacting Jeff Paul (jeff.paul@statcan.gc.ca).
For more information, contact us (toll-free 1-800-263-1136; 514-283-8300; infostats@statcan.gc.ca). To enquire about the concepts, methods or data quality of this release, contact Jeff Paul (statcan.mediahotline-ligneinfomedias.statcan@statcan.gc.ca), Mining, Manufacturing, and Wholesale Trade Division.
* All content is copyrighted by Industry Intelligence, or the original respective author or source. You may not recirculate, redistrubte or publish the analysis and presentation included in the service without Industry Intelligence's prior written consent. Please review our terms of use.


