OTTAWA
,
November 27, 2023
(press release)
–
Retail sales increased 0.6% to $66.5 billion in September. Sales were up in four of nine subsectors and were led by increases at motor vehicle and parts dealers (+1.5%). Core retail sales—which exclude gasoline stations and fuel vendors and motor vehicle and parts dealers—were down 0.3% in September. In volume terms, retail sales increased 0.3% in September. Retail sales were up 0.6% in the third quarter, while in volume terms, retail sales declined 0.5%. Chart 1: Retail sales increase in September Sales at motor vehicle and parts dealers rise Also contributing to the increase in retail sales in September were higher sales at gasoline stations and fuel vendors (+3.2%). In volume terms, sales at gasoline stations and fuel vendors increased 2.3%. Core retail sales decline The largest increase to core retail sales in September came from general merchandise retailers (+0.3%). Sales were up in this subsector for the third consecutive month. Chart 2: Sales increase in four of nine subsectors in September Sales up in eight provinces In Alberta, retail sales were up 0.9% in September. The increase was driven by higher sales at general merchandise retailers. The largest provincial decrease in September was observed in New Brunswick (-0.2%), led by lower sales at motor vehicle and parts dealers. After their decline in August, retail sales in the Northwest Territories increased 26.6% in September. Retail e-commerce sales in Canada Advance retail indicator Note to readers Seasonally adjusted data are data that have been modified to eliminate the effect of seasonal and calendar influences to allow for more meaningful comparisons of economic conditions from period to period. For more information on seasonal adjustment, see Seasonally adjusted data – Frequently asked questions. The percentage change for the advance estimate of retail sales is calculated using seasonally adjusted data and is expressed in current dollars. This early indicator is a special unofficial estimate being provided in the context of the COVID-19 pandemic to offer Canadians timely information on the retail sector. The data sources and methodology used are the same as those outlined on the Monthly Retail Trade Survey information page. Trend-cycle estimates are included in selected charts as a complement to the seasonally adjusted series. These data represent a smoothed version of the seasonally adjusted time series and provide information on longer-term movements, including changes in direction underlying the series. For information on trend-cycle data, see Trend-cycle estimates – Frequently asked questions. Both seasonally adjusted data and trend-cycle estimates are subject to revision as additional observations become available. These revisions could be extensive and could even lead to a reversal of movement, especially for the reference months near the end of the series or during periods of economic disruption. Seasonally adjusted estimates for cannabis store retailers are presented in unadjusted form, as no seasonal pattern has been established by official statistics yet. Establishing such a pattern requires several months of observed data. In the interim, the seasonally adjusted estimates for cannabis store retailers will be identical to the unadjusted figures. Some common e-commerce transactions, such as travel and accommodation bookings, ticket purchases and financial transactions, are not included in Canadian retail sales figures. Total retail sales expressed in volume terms are calculated by deflating current-dollar values using consumer price indexes. Find more statistics on retail trade. Next release Contact information Industry Intelligence Editor's Note: This press release omits select charts and/or marketing language for editorial clarity. Click here to view the full report.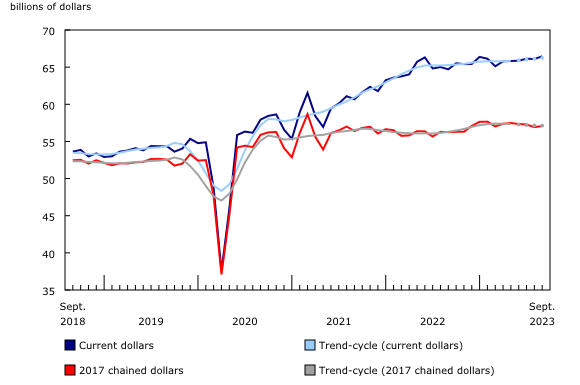
The largest increase to retail sales in September came from motor vehicle and parts dealers (+1.5%). The gain was led by higher sales at new car dealers (+2.4%). The largest decline in this subsector came from used car dealers (-2.0%), followed by other motor vehicle dealers (-1.5%).
Core retail sales decreased 0.3% in September, led by lower sales at sporting goods, hobby, musical instrument, book and miscellaneous retailers (-1.6%) and food and beverage retailers (-0.4%). Sales at food and beverage retailers were down on lower sales at beer, wine and liquor retailers (-1.8%), supermarkets and other grocery retailers (except convenience retailers) (-0.2%) and specialty food retailers (-0.4%).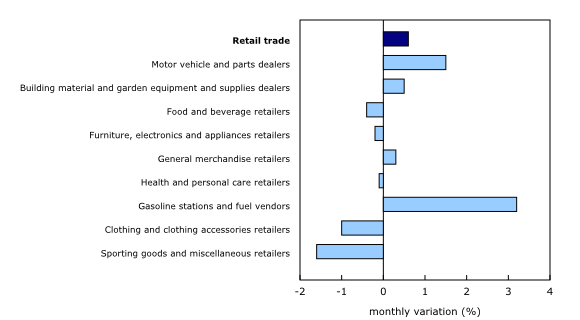
Retail sales increased in eight provinces in September. The largest provincial increase was observed in Ontario (+0.3%), led by higher sales at motor vehicle and parts dealers. In the census metropolitan area of Toronto, sales were down 0.6%.
On a seasonally adjusted basis, retail e-commerce sales were down 0.6% to $3.8 billion in September, accounting for 5.8% of total retail trade.
Statistics Canada is providing an advance estimate of retail sales, which suggests that sales increased 0.8% in October. Owing to its early nature, this figure will be revised. This unofficial estimate was calculated based on responses received from 48.7% of companies surveyed. The average final response rate for the survey over the previous 12 months was 88.6%.
All data in this release are seasonally adjusted and expressed in current dollars, unless otherwise noted.
Data on retail trade for October will be released on December 21, 2023.
For more information, or to enquire about the concepts, methods or data quality of this release, contact us (toll-free 1-800-263-1136; 514-283-8300; infostats@statcan.gc.ca) or Media Relations (statcan.mediahotline-ligneinfomedias.statcan@statcan.gc.ca).
* All content is copyrighted by Industry Intelligence, or the original respective author or source. You may not recirculate, redistrubte or publish the analysis and presentation included in the service without Industry Intelligence's prior written consent. Please review our terms of use.


