OTTAWA
,
May 26, 2022
(press release)
–
Retail sales were virtually unchanged in March. Sales were up in 10 of 11 subsectors, led by higher sales at gasoline stations (+7.4%). Lower sales at motor vehicle and parts dealers (-6.4%) erased the gains observed in the remaining subsectors. Sales were up in 10 of 11 subsectors, representing 75.0% of retail trade. Core retail sales—which exclude gasoline stations and motor vehicle and parts dealers—increased 1.5% in March. In volume terms, retail sales were down 1.0% in March. Retail sales were up 3.0% in the first quarter of 2022. This was the largest quarterly increase since the third quarter of 2020. In volume terms, quarterly sales edged up 0.2%. Given the continually evolving economic situation, Statistics Canada is providing an advance estimate of retail sales, which suggests that sales increased 0.8% in April 2022. Owing to its early nature, this figure will be revised. This unofficial estimate was calculated based on responses received from 54.3% of companies surveyed. The final average response rate for the survey over the previous 12 months has been 92.1%. Chart 1: Retail sales virtually unchanged in March Sales at gasoline stations rise while sales at motor vehicle and parts dealers decline Sales fell 6.4% at motor vehicle and parts dealers, led by lower sales at new car dealers (-5.9%). This was the largest decline at motor vehicle and parts dealers since sales plunged 42.8% at the onset of the COVID-19 pandemic in April 2020. The Bank of Canada's Monetary Policy Report noted that semiconductor chip shortages are continuing to impact production and prices for motor vehicles. The report also noted that while consumption growth for most goods is expected to moderate, spending on motor vehicles should pick up as supply chain shortages ease. Core retail sales rise Receipts rose 0.9% at food and beverage stores, led by higher sales at supermarkets and other grocery stores (+1.6%). The Consumer Price Index noted that food prices continued to rise in March, up 8.7% from the previous year. Higher input prices and transportation costs have continued to impact grocery prices. Sales were also up at miscellaneous store retailers (+5.9%) and clothing and clothing accessories stores (+2.2%). Chart 2: Sales increase in 10 of the 11 subsectors in March Sales increase in four provinces Sales rose 0.3% in Ontario, also on higher sales at gasoline stations. In contrast, sales edged down 0.3% in the census metropolitan area (CMA) of Toronto. In March, lower sales were observed in Quebec (-0.8%), British Columbia (-0.5%) and Saskatchewan (-1.6%). Retail e-commerce sales in Canada On an unadjusted basis, retail e-commerce sales fell 24.6% year over year to $3.0 billion in March, accounting for 4.9% of total retail trade. The share of e-commerce sales out of total retail sales fell 1.9 percentage points compared with March 2021. Note to readers Seasonally adjusted data are data that have been modified to eliminate the effect of seasonal and calendar influences to allow for more meaningful comparisons of economic conditions from period to period. For more information on seasonal adjustment, see Seasonally adjusted data – Frequently asked questions. The percentage change for the advance estimate of retail sales is calculated using seasonally adjusted data and is expressed in current dollars. This early indicator is a special product being provided in the context of the COVID-19 pandemic to offer Canadians timely information on the retail sector. The data sources and methodology used are the same as those outlined on the Monthly Retail Trade Survey information page. Trend-cycle estimates are included in selected charts as a complement to the seasonally adjusted series. These data represent a smoothed version of the seasonally adjusted time series and provide information on longer-term movements, including changes in direction underlying the series. For information on trend-cycle data, see Trend-cycle estimates – Frequently asked questions. Both seasonally adjusted data and trend-cycle estimates are subject to revision as additional observations become available. These revisions could be extensive and could even lead to a reversal of movement, especially for the reference months near the end of the series or during periods of economic disruption. Seasonally adjusted estimates for cannabis store retailers are presented in unadjusted form since no seasonal pattern has been established by official statistics yet. Establishing such a pattern requires several months of observed data. In the interim, the seasonally adjusted estimates for cannabis store retailers will be identical to the unadjusted figures. Statistics Canada's retail e-commerce figures include the electronic sales of two distinct types of retailers. The first type does not have a storefront. These businesses are commonly referred to as pure-play Internet retailers and are classified under the North American Industry Classification System (NAICS) code 45411—electronic shopping and mail-order houses. The second type has a storefront and is commonly referred to as a brick-and-mortar retailer. If the online operations of a brick-and-mortar retailer are separately managed, they, too, are classified under NAICS code 45411. Some common e-commerce transactions, such as travel and accommodation bookings, ticket purchases, and financial transactions, are not included in Canadian retail sales figures. For more information on the Bank of Canada Monetary Policy Report, please consult the report here. For more information on retail e-commerce in Canada, see "Retail E-Commerce in Canada." Total retail sales expressed in volume terms are calculated by deflating current-dollar values using consumer price indexes. Find more statistics on retail trade. Real-time tables Next release Contact information Industry Intelligence Editor's Note: This press release omits select charts and/or marketing language for editorial clarity. Click here to view the full report.
Receipts at gasoline stations were up 7.4% in March. This was the third consecutive increase and tenth gain in the last 11 months. In volume terms, sales were up 3.1%. Gasoline prices rose 11.8% on a monthly basis, partly due to uncertainty surrounding supply following Russia's invasion of Ukraine.
Leading the increase in core retail were higher sales at building material and garden equipment and supplies dealers (+3.7%). Sales were up for the seventh time in the last eight months.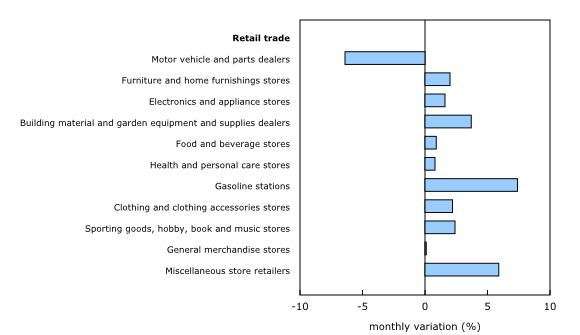
Retail sales were up in four provinces in March, led by higher sales in Alberta (+1.8%). Higher sales at gasoline stations led the gain in this province.
On a seasonally adjusted basis, retail e-commerce sales were down 1.9% in March.
All data in this release are seasonally adjusted and expressed in current dollars, unless otherwise noted.
Real-time tables 20-10-0054-01 and 20-10-0079-01 will be updated soon.
Data on retail trade for April will be released on June 21, 2022.
For more information, or to enquire about the concepts, methods or data quality of this release, contact us (toll-free 1-800-263-1136; 514-283-8300; infostats@statcan.gc.ca) or Media Relations (statcan.mediahotline-ligneinfomedias.statcan@statcan.gc.ca).
* All content is copyrighted by Industry Intelligence, or the original respective author or source. You may not recirculate, redistrubte or publish the analysis and presentation included in the service without Industry Intelligence's prior written consent. Please review our terms of use.


