OTTAWA
,
May 31, 2023
(press release)
–
Real gross domestic product (GDP) rose 0.8% in the first quarter, after posting no change in the previous quarter. Favourable international trade and growth in household spending were moderated by slower inventory accumulations as well as declines in housing investment and business investment in machinery and equipment. Final domestic demand increased 0.7% in the first quarter of 2023 after remaining flat in the fourth quarter of 2022. Chart 1: Real gross domestic product and final domestic demand Chart 2: Contributions to percentage change in real gross domestic product, first quarter of 2023 Exports rise, imports edge up Chart 3: Top contributors to real exports, first quarter of 2023 Imports of goods and services edged up 0.2% in the first quarter of 2023, following a 3.3% decline in the fourth quarter of 2022. Higher imports of crude oil and crude bitumen led the increase, followed by pharmaceutical and medicinal products, and travel service expenses by Canadians abroad. These gains were largely offset by declines in imports of passenger cars and light trucks, unwrought gold, silver, and platinum group metals and their alloys, and clothing, footwear, and accessories. Higher household spending spurs growth Chart 4: Real household final consumption of durable goods, semi-durable goods, and services Service spending picked up in the first quarter of 2023, led by food and non-alcoholic beverage services (+4.4%), and alcoholic beverage services (+6.5%). Meanwhile, travel was on the rise with expenditures by Canadians abroad up 6.8% in the first quarter, compared with a 3.3% decrease in the previous quarter. Housing investment continues to decline Business investment in machinery and equipment declines The declines in business investment were partly offset by increased investment in engineering structures by the oil and gas industry and higher business investment in intellectual property products, largely stemming from software. Inventory accumulation slows Terms of trade declines and gross domestic product implicit prices rise Chart 5: Gross domestic product price indexes, selected components The GDP implicit price index—a measure of economy-wide prices—edged up 0.2% in the first quarter of 2023, primarily because of higher household expenditure prices. The price index for household final consumption expenditure (excluding food and energy) rose 1.0% in the first quarter, the 11th consecutive quarterly increase, as inflation remained elevated above the Bank of Canada's target. Compensation of employees up The total wages and salaries paid in the goods-producing industries rose 2.3% in the first quarter of 2023, while total wages and salaries paid in the service-producing industries grew by 1.6%. The major contributors to wage growth in the first quarter were professional and personal services (+3.2%), manufacturing (+2.8%) and construction (+2.0%). Map 1: Compensation of employees, quarter-to-quarter % change, seasonally adjusted data Compensation of employees increased in all provinces and territories in the first quarter of 2023. Growth was highest in Nunavut and the Northwest Territories (+3.1%) and Prince Edward Island (+3.1%), followed by New Brunswick (+2.4%) and Saskatchewan (+2.4%). Growth was lowest in Yukon (+0.7%). Household saving rate falls on lower disposable income Chart 6: Household sector, selected components, seasonally adjusted, annual rates Current transfers received were lower in the first quarter of 2023 as the previous quarter included the GST top-up, as well as various provincial measures to ease the impact of inflation. The first quarter also reflected repayments of various COVID-19 support benefits. As well, persistently high interest rates had a predominantly negative effect on net property income, as increases in interest income (+6.4%), mainly from deposits, did not keep pace with higher interest payments on mortgages (+14.7%) and consumer credit (+10.9%). In contrast with lower disposable income, consumption expenditures (in nominal terms) rose 2.1% in the first quarter of 2023. This was a faster pace than the 1.4% recorded in the fourth quarter of 2022 partly due to inflationary pressures. As a result, the household saving rate was 2.9% in the first quarter of 2023, down from 5.8% at the end of 2022. The household saving rate approached the pre-pandemic level, which averaged 2.1% in 2019. Corporate incomes weaker Weaker energy prices, and as a result, lower incomes among energy-related industries were largely responsible for the decline in gross operating surplus in the first quarter. The nominal value of energy exports fell 12.6% in the first quarter, following a 12.5% drop in the fourth quarter of 2022. Financing costs composed of interest paid to residents and non-residents represented almost one-fifth of operating surplus in the first quarter of 2023 and have increased 12.5% since the first quarter of 2022. The gross operating surplus of financial corporations fell 1.3% in the first quarter of 2023, the sixth consecutive quarterly decline. Interest rates have been rising during the same period since the Bank of Canada began a course of monetary tightening in early 2022. Among deposit-taking institutions, record mortgage lending and rising interest rates contributed to rapid increases in interest revenues throughout 2022 and into 2023. At the same time, interest expenses also increased. Federal government debt charges climb Note to readers Re-referencing of the volume and price estimates This re-referencing exercise will be coordinated with re-referencing activities of other volume measures within the Canadian Macroeconomic Accounts, such as the Canadian International Merchandise Trade and the Stock and Consumption of Fixed Capital Program. The provincial-territorial economic accounts for 2022, to be released on November 8, 2023, will also be on a 2017=100 basis for price and volume estimates. Accounting for e-commerce transactions with non-resident vendors This adjustment has been in place since the fourth quarter of 2019. For the first quarter of 2023, the adjustment represents $651.9 million compared with $856.4 million in the fourth quarter of 2022, applied to the household consumption indicators. The adjustment is derived using sources such as details from customs transactions, Goods and Services Tax remittances and financial statements for certain enterprises. The 2022 total adjustment represents approximately $3.2 billion, which is down compared with the approximately $4.0 billion in 2021. Weapons systems Support measures by governments Details of the more significant federal government measures covering the period from the first quarter of 2020 to the first quarter of 2023 have been updated and are available in this release. General For information on seasonal adjustment, see Seasonally adjusted data – Frequently asked questions. Real-time tables Next release Products The document, "Recording new COVID measures in the national accounts," which is part of Latest Developments in the Canadian Economic Accounts (Catalogue number13-605-X), is available. The data visualization product "Overview of the stock and consumption of fixed capital program: Interactive tool," which is part of Statistics Canada – Data Visualization Products (Catalogue number71-607-X), is now available. The Economic accounts statistics portal, accessible from the Subjects module of the Statistics Canada website, features an up-to-date portrait of national and provincial economies and their structure. The User Guide: Canadian System of Macroeconomic Accounts (Catalogue number13-606-G) is available. The Methodological Guide: Canadian System of Macroeconomic Accounts (Catalogue number13-607-X) is available. Contact information Industry Intelligence Editor's Note: This press release omits select charts and/or marketing language for editorial clarity. Click here to view the full report.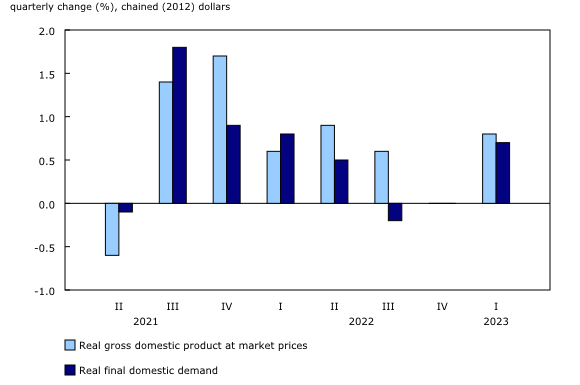

Exports of goods and services rose 2.4% in the first quarter of 2023, following a 0.5% increase in the fourth quarter of 2022. The increase in the first quarter was led by passenger cars and light trucks, unwrought gold, silver, and platinum group metals and their alloys, other crop products, and wheat.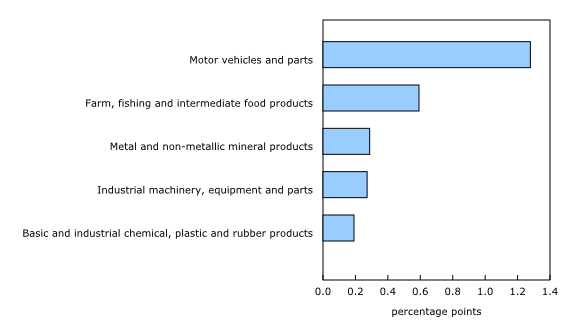
After two quarters of minimal growth, household spending rose for both goods (+1.5%) and services (+1.3%) in the first quarter of 2023. Expenditures on durable goods (+3.3%) were driven by motor vehicles including new trucks, vans, and sport utility vehicles (+7.8%). Spending on semi-durables (+4.3%) was led by garments (+4.5%), while spending on non-durable goods (-0.2%) declined slightly.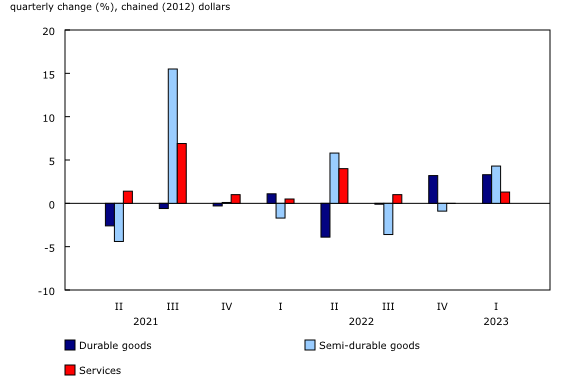
Coinciding with higher borrowing costs and slowing mortgage borrowing, housing investment fell 3.9% in the first quarter of 2023, the fourth consecutive quarterly decrease. The decline in investment was widespread—as new construction (-6.0%), renovations (-2.1%), and ownership transfer costs (-1.5%), which represents resale activity, were all down. The decline in new construction was observed in every province and territory except Yukon.
Business investment in machinery and equipment fell 2.5% in the first quarter of 2023, the third consecutive quarterly decline. The decrease was led by lower spending on medium and heavy trucks, buses and other motor vehicles, and aircraft and other transportation equipment.
Lower inventory accumulations in the first quarter applied downward pressure on GDP growth, the smallest change in inventories since the fourth quarter of 2021. Declines in farm inventories as well as in the stock of durable goods, such as in motor vehicles, contributed to the limited inventory accumulation.
The ratio of the price of exports to the price of imports—the terms of trade—fell 2.7% in the first quarter of 2023, primarily because of a 3.4% decline in prices of exported goods. This was the third consecutive quarterly decrease in the terms of trade, as prices of exported goods continued to fall after reaching a record high in the first two quarters of 2022.
Compensation of employees rose 1.7% in the first quarter, following a 1.2% increase in the previous quarter. This was the largest quarterly growth in compensation of employees since the second quarter of 2022.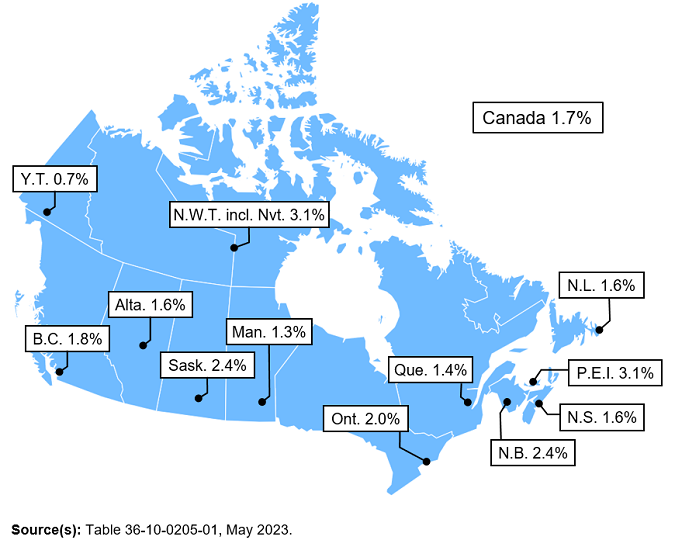
Household disposable income decreased by 1.0% in the first quarter, the first reduction since the fourth quarter of 2021. Although strong labour and housing market conditions had a positive impact on compensation of employees (+1.8%) and rental income (+4.7%), these gains were more than offset by decreases in current transfers received (-5.8%) and net property income (-2.4%).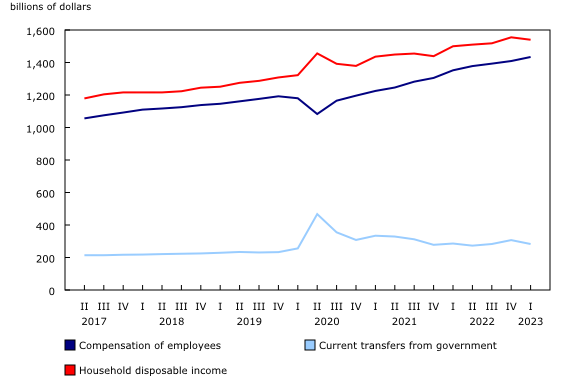
After declining in the last half of 2022, the incomes of non-financial corporations continued to fall in the first quarter of 2023. Overall, gross operating surplus for the non-financial corporations was down 2.2% in the first quarter.
Overall general government, comprised of all levels of government, recorded a 1.6% increase in revenue in the first quarter of 2023, while expenditures declined 2.6%, largely because of lower transfers to households. Federal government property income payments, or the interest on outstanding debt, rose 9.2% in the first quarter and represented 8.3% of federal government expenditure. By comparison, this share was 6.7% in the last quarter of 2019. Overall, according to the Securities statistics program, there were roughly $370 billion in federal government debt securities at the end of 2022 that will reach maturity by the end of 2023.
Updates to data estimates
Gross domestic product (GDP) data for the first quarter of 2023 have been released along with updated data from the first quarter of 2022. Updates to the first quarter to the fourth quarter of 2022 were due to the incorporation of updated source data. Data on targeted COVID-19 related government support measures were also revised for the first two quarters of 2022. A new data table with housing stock in units has been published with this release.
Volume and price estimates for the quarterly GDP and accompanying set of accounts will be updated to 2017 (2017=100) reference year with the third quarter 2023 release in November 2023. Additionally, at that time, the international trade classification will be updated to the North American Product Classification System (NAPCS) 2022. Given the inclusion of a more recent NAPCS and reference year, price baskets will also be updated.
The indicators used to estimate Household Final Consumption Expenditure have been adjusted to account for non-resident e-commerce sales. The Monthly Retail Trade Survey collects data only on resident vendor e-commerce sales. The non-resident vendor e-commerce adjustment, which is applied to the indicators to estimate household consumption, mainly the Retail Commodity Survey, is a non-seasonally adjusted, quarterly value.
To account for the aid contributions that Canada has given to Ukraine throughout the ongoing conflict, estimates for disinvestment of assets in weapons systems have been implemented since the first quarter of 2022. Weapon systems include military equipment such as weapon platforms, vehicles, and other equipment, but exclude single use items such as ammunition, which are instead classified to government inventories. Disinvestment for the first quarter of 2023 totalled $10 million compared with $25 million in the fourth quarter of 2022.
To alleviate the economic impact of the pandemic, governments implemented programs which supported households and businesses, such as the Canada Emergency Wage Subsidy, Canada Emergency Rent Subsidy, and the Canada Recovery Benefit. A comprehensive explanation of how government support measures were treated in the compilation of the estimates is available in "Recording COVID-19 measures in the national accounts" and "Recording new COVID measures in the national accounts."
Percentage changes for expenditure-based statistics (such as household spending, investment, and exports) are calculated from volume measures that are adjusted for price variations. Percentage changes for income-based statistics (such as compensation of employees and operating surplus) are calculated from nominal values; that is, they are not adjusted for price variations. Unless otherwise stated, growth rates represent the percentage change in the series from one quarter to the next: for instance, from the fourth quarter of 2022 to the first quarter of 2023.
Real-time tables 36-10-0430-01 and 36-10-0431-01 will be updated on June 5, 2023.
Data on GDP by income and expenditure for the second quarter of 2023 will be released on September 1, 2023.
The data visualization product "Gross Domestic Product by Income and Expenditure: Interactive tool," which is part of the Statistics Canada – Data Visualization Products series (Catalogue number71-607-X), is now available.
For more information, or to enquire about the concepts, methods or data quality of this release, contact us (toll-free 1-800-263-1136; 514-283-8300; infostats@statcan.gc.ca) or Media Relations (statcan.mediahotline-ligneinfomedias.statcan@statcan.gc.ca).
* All content is copyrighted by Industry Intelligence, or the original respective author or source. You may not recirculate, redistrubte or publish the analysis and presentation included in the service without Industry Intelligence's prior written consent. Please review our terms of use.


