OTTAWA
,
January 27, 2022
(press release)
–
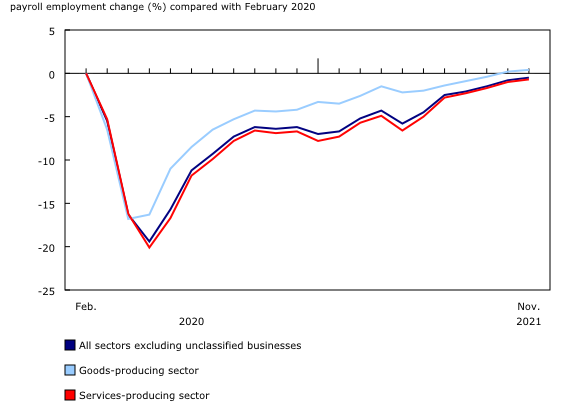
The number of employees receiving pay or benefits from their employer—measured by the Survey of Employment, Payrolls and Hours (SEPH) as payroll employment—rose by 37,200 (+0.2%) in November, the sixth consecutive monthly increase, bringing it to within 0.4% of its pre-pandemic level. Payroll employment increase in November led by services-producing sector Almost two-thirds of the increase in payroll employment in November occurred in Quebec (+23,800; +0.6%), driven by public administration (+7,700; +2.8%), manufacturing (+5,400; +1.2%) and accommodation and food services (+4,000; +1.7%). On the other hand, there were fewer payroll employees in Alberta (-8,800; -0.4%) and Saskatchewan (-3,300; -0.7%). Chart 1: Payroll employment increases for the sixth consecutive month in November Payroll employment in the goods-producing sector rose by 8,300 (+0.3%) in November, led by construction (+2,800; +0.3%). The goods-producing sector was 0.4% above its pre-pandemic employment level, while in the services-producing sector, it was 0.7% lower than in February 2020. Chart 2: Payroll employment in goods-producing sector surpasses pre-COVID level Employment gains in food services and drinking places as public health measures continue to ease Despite recent gains, payroll employment in accommodation and food services has not returned to pre-pandemic levels and was down 166,500 (-12.4%) in November compared with February 2020. Full-service restaurants and limited-service eating places (-95,300; -9.3%) was furthest below its pre-COVID employment level in November, while rooming and boarding houses was the lone industry in accommodation and food services to have returned to its pre-COVID employment level. Experimental estimates for business openings and closures indicated there were 3.5% fewer active businesses in food and accommodation in October compared with February 2020. Payroll employment recovery uneven in transportation and warehousing Payroll employment in transportation and warehousing was down 20,200 (-2.6%) in November compared with February 2020. Scheduled air transportation (-26,000; -39.1%), an industry very affected by public health related travel restrictions, was furthest below its pre-COVID employment level. On the other hand, industries potentially benefiting from the increase in online shopping, such as couriers (+11,300; +23.2%) and postal service workers (+7,600; + 11.0%), were furthest above pre-COVID employment levels. Payroll employment in construction continues to increase Nationally, all industries within the construction sector had either returned to or surpassed their pre-pandemic employment level in November, with the exception of land subdivision (-200; -1.5%). Businesses in this group primarily engage in servicing land and subdividing real property into lots for sale to builders. Additionally, average weekly earnings in construction rose 1.6% to $1,422 in November and were 8.1% above their February 2020 level. Average weekly hours and earnings little changed in November Average weekly earnings were little changed in November, at $1,131. Job vacancies continue to be high The job vacancy rate, which measures vacant positions as a share of all positions (vacant and occupied) was 5.1% in November, up 2.1 percentage points from the fourth quarter of 2019, but 0.8 percentage points below the peak of 5.9% reached in September 2021. Record high job vacancies in transportation and warehousing Other key industries continue to face high job vacancies Unmet demand for healthcare workers remained high in November. Despite declining for the third consecutive month, there were 119,600 vacancies in health care and social assistance, and the job vacancy rate was 5.2%. The number of vacancies was 87.0% (+55,600) higher in November than in the fourth quarter of 2019. In construction, there were 67,800 job vacancies in November, more than twice as many as in the fourth quarter of 2019 (+106.5%). The job vacancy rate almost doubled from 2.9% in the fourth quarter of 2019 to 5.6% in November 2021. Job vacancies in retail trade and manufacturing decline after hitting record high in October Job vacancies in manufacturing declined 10.1% (-9,200) to 81,800 in November. Nevertheless, the number of job vacancies was 93.9% higher (+39,600) than in the fourth quarter of 2019 and the job vacancy rate was up 2.4 percentage points (to 5.0%) over the same period. Drop in job vacancies in six provinces For the third straight month, the number of job vacancies in Quebec (231,800) exceeded the number of unemployed persons (185,000). (Data on unemployment are from the Labour Force Survey, not seasonally adjusted). The unemployment to job vacancy ratio was lowest in Quebec (0.8), British Columbia (1.2) and Manitoba (1.2) in November. Note to readers Payroll employment, as measured by the SEPH, refers to the number of employees receiving pay or benefits (employment income) during a given month. The survey excludes the self-employed, owners and partners of unincorporated businesses and professional practices, and employees in the agricultural sector. SEPH estimates are produced by integrating information from three sources: a census of approximately 1 million payroll deduction records provided by the Canada Revenue Agency; the Business Payrolls Survey, which collects data from a sample of 15,000 establishments; and administrative records of federal, provincial and territorial public administration employment, provided by these levels of government. Estimates of average weekly earnings and hours worked are based on a sample and are therefore subject to sampling variability. This analysis focuses on differences between estimates that are statistically significant at the 68% confidence level. Payroll employment estimates are based on a census of administrative records and are not subject to sampling variability. With each release of SEPH data, data for the preceding month are revised. Users are encouraged to use the most up-to-date data available for each month. Statistics Canada also produces employment estimates from its Labour Force Survey (LFS). The LFS is a monthly household survey, the main objective of which is to divide the working-age population into three mutually exclusive groups: the employed (including the self-employed), the unemployed and those not in the labour force. This survey is the official source for the unemployment rate, and it collects data on the sociodemographic characteristics of all those in the labour market. As a result of conceptual and methodological differences, estimates of changes from the SEPH and the LFS differ occasionally. However, the trends in the data are similar. For a more in-depth discussion of the conceptual differences between employment measures from the LFS and the SEPH, refer to Section 8 of the Guide to the Survey of Employment, Payrolls and Hours (Catalogue number72-203-G). Unless otherwise stated, this release presents seasonally adjusted data, which facilitate comparisons because the effects of seasonal variations are removed. For more information on seasonal adjustment, see Seasonally adjusted data – Frequently asked questions. Non-farm payroll employment data are for all hourly and salaried employees and for the "other employees" category, which includes piece-rate and commission-only employees. Unless otherwise specified, average weekly hours data are for hourly and salaried employees only and exclude businesses that could not be classified to a North American Industry Classification System (NAICS) code. All earnings data include overtime and exclude businesses that could not be classified to a NAICS code. Earnings data are based on gross taxable payroll before source deductions. Average weekly earnings are derived by dividing total weekly earnings by the number of employees. Job Vacancy and Wage Survey JVWS collection is done on a quarterly basis. The quarterly sample of business locations is allocated to the three collection months of the quarter, approximately balanced by province and by industrial sector across each of the three months. This allows both quarterly and monthly estimates to be produced. The JVWS also provides comprehensive quarterly data on job vacancies by industrial sector and detailed occupation for Canada and the provinces, territories and economic regions; offered hourly wages; and job vacancy characteristics. Quarterly data for the second and third quarters of 2020 are unavailable because survey operations were temporarily suspended during the COVID-19 pandemic. More information about the concepts and use of data from the JVWS is available in the Guide to the Job Vacancy and Wage Survey (Catalogue number75-514-G). Preliminary monthly estimates are produced for job vacancies, job vacancy rates and payroll employment using available responses from business locations sampled in the corresponding reference month. The reference period for the JVWS is the first day of the respective month. These preliminary monthly estimates are revised and finalized when the corresponding quarterly estimates are released or shortly thereafter. Users are encouraged to use the most up-to-date data available for each month. JVWS estimates are not seasonally adjusted. Therefore, month-to-month and quarter-to-quarter comparisons should be interpreted with caution as they may reflect seasonal movements. While JVWS employment is calibrated to the SEPH, SEPH payroll employment and JVWS preliminary monthly employment figures may differ because of calibration grouping and differences in scope and reference period. Real-time data tables Next release Products The product "Earnings and payroll employment in brief: Interactive app" (14200001) is now available. This interactive data visualization application provides a comprehensive picture of the Canadian labour market using the most recent data from the Survey of Employment, Payrolls and Hours. The estimates are seasonally adjusted and available by province and largest industrial sector. Historical estimates going back 10 years are also included. The interactive application allows users to quickly and easily explore and personalize the information presented. Combine multiple provinces and industrial sectors to create your own labour market domains of interest. Contact information Industry Intelligence Editor's Note: This press release omits select charts and/or marketing language for editorial clarity. Click here to view the full report.
Payroll employment gains in November were driven by the services-producing sector (+36,500; +0.3%). Nationally, there were more payroll employees in 7 of the 15 subgroups in the services-producing sector, led by accommodation and food services (+11,100; +1.0%), public administration (+9,000; +0.8%) and professional, scientific and technical services (+7,400; +0.7%).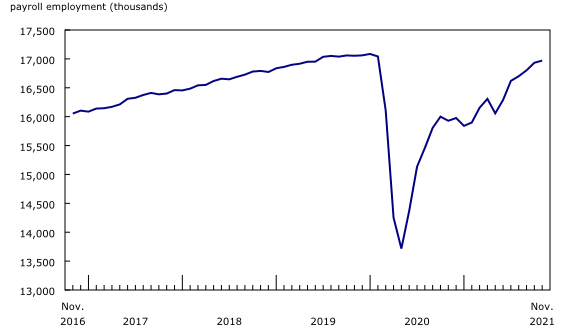
In accommodation and food services, payroll employment rose by 11,100 (+1.0%) in November, the sixth consecutive monthly increase. Food services and drinking places accounted for most of the gain (+8,500; +0.8%), while payroll employment in accommodation services rose by 2,600 (+1.7%). During the last week of October and first week of November, capacity limits and distancing requirements were further eased for many businesses in Ontario and Quebec, including in the accommodation and food services sector.
Payroll employment in transportation and warehousing was little changed in November. The largest payroll employment increase in transportation and warehousing was in scheduled air transportation (+1,600; +4.0%) and the charter bus industry (+600; +17.1%). Gains were mostly offset by fewer payroll employees in general freight trucking (-1,700; -1.3%) and support activities for road transportation (-1,100; -3.6%), two industries potentially affected by severe flooding in British Columbia in mid-November.
Payroll employment in construction increased by 2,800 (+0.3%) in November, with the pace of growth slowing from October (+7,100; +0.7%) and September (+10,500; +1.0%). Following the province's notable gains in October in both residential and commercial investments in building construction, Quebec (+2,400; +1.1%) reported the largest monthly payroll employment increase in November, making it the province furthest above its pre-COVID level (+13,800; +6.5%) in this sector.
Average weekly hours were little changed in November. Hourly paid employees worked on average 31.1 hours per week, while salaried employees worked 37.0 hours per week.
Canadian employers were seeking to fill 874,700 vacant jobs at the beginning of November, down 9.3% (-89,600) compared with October, but still much higher than prior to the pandemic. The number of vacancies was up 72.0% (+366,100) compared with the fourth quarter of 2019. (Data from the Job Vacancy and Wage Survey [JVWS] are not seasonally adjusted).
The number of job vacancies in transportation and warehousing reached an all-time high of 51,500 in November, while payroll employment was little changed from October. The job vacancy rate in this sector was 6.2% in November, the highest monthly rate since comparable data became available in October 2020.
Job vacancies decreased in accommodation and food services for the second consecutive month in November, falling 11.7% to 130,100. Labour demand in this sector typically peaks in the summer and declines in the fall. The number of job vacancies was, however, more than double (+68,300; +110.7%) the level measured in the fourth quarter of 2019. Despite the decrease in vacancies in the month, the accommodation and food services sector had a higher job vacancy rate (9.9% in November) than all other sectors for the seventh consecutive month.
Job vacancies in retail trade fell by 28,800 (-21.7%) to 104,000 in November, while the number of payroll employees in the sector increased by 29,900 (not seasonally adjusted).
Compared with October, job vacancies declined in six provinces in November (not seasonally adjusted). Proportionally, the largest declines were in Newfoundland and Labrador (-3,600; -41.5%) and New Brunswick (-3,100; -20.7%), while Quebec (-17,800; -7.1%) had the smallest decline. Although the number of job vacancies in Manitoba reached a record high of 27,300, the province's job vacancy rate (4.5%) remained below the national average (5.1%).
Survey of Employment, Payrolls and Hours
The key objective of the Survey of Employment, Payrolls and Hours (SEPH) is to provide a monthly portrait of the level of earnings, employment and hours worked, by detailed industry, at the national, provincial and territorial levels.
Beginning with the release of October 2020 data, preliminary monthly estimates from the Job Vacancy and Wage Survey (JVWS) are published on a monthly basis. These estimates provide more timely information on the number of job vacancies and the job vacancy rate by province and by industrial sector.
Real-time data tables 14-10-0357-01, 14-10-0358-01, 14-10-0331-01 and 14-10-0332-01 will be updated on February 14, 2022.
Data on payroll employment, earnings and hours, and job vacancies for December 2021 will be released on February 24, 2022.
More information about the concepts and use of the Survey of Employment, Payrolls and Hours is available in the Guide to the Survey of Employment, Payrolls and Hours (Catalogue number72-203-G).
For more information, or to enquire about the concepts, methods or data quality of this release, contact us (toll-free 1-800-263-1136; 514-283-8300; infostats@statcan.gc.ca) or Media Relations (statcan.mediahotline-ligneinfomedias.statcan@statcan.gc.ca).
* All content is copyrighted by Industry Intelligence, or the original respective author or source. You may not recirculate, redistrubte or publish the analysis and presentation included in the service without Industry Intelligence's prior written consent. Please review our terms of use.


