OTTAWA
,
May 26, 2022
(press release)
–
The number of employees receiving pay or benefits from their employer—measured by the Survey of Employment, Payrolls and Hours (SEPH) as payroll employment—increased by 118,100 (+0.7%) in March. The increase in payroll employment coincided with the continued easing of public health measures, as remaining capacity limits affecting business operations had generally been lifted by the first two weeks of March, although some combination of masking, proof of COVID-19 vaccination, or COVID-19 testing remained a requirement in some settings in certain jurisdictions. Chart 1: Payroll employment increases in March Payroll employment increases in most provinces in March, driven by the services-producing sector Quebec (+57,100; +1.5%) recorded the largest payroll employment increase in March, driven by gains in the accommodation and food services sector (+20,400; +9.1%), which was boosted by the provincial reopening of bars, taverns and casinos on February 28, 2022. Nationally, payroll employment gains in March were driven by the services-producing sector (+103,400; +0.7%), led by accommodation and food services (+46,200; +4.0%) and retail trade (+14,800; +0.7%). In the goods-producing sector, payroll employment increased by 9,400 (+0.3%), with gains in manufacturing (+5,100; +0.3%) and mining, quarrying, and oil and gas extraction (+2,100; +1.1%). Retail trade surpasses its pre-pandemic payroll employment level for the first time Nationally, more than half of the subsectors within retail trade reported payroll employment increases in March, led by food and beverage stores (+7,400; +1.4%) and clothing and clothing accessories stores (+3,300; +1.7%). While total payroll employment in food and beverage stores was above its pre-pandemic level (+8,700; +1.6%) in March, industries within this subsector had not recovered at the same pace. In the grocery stores industry, payroll employment was 2.8% above its pre-pandemic level in March. In the beer, wine and liquor stores industry, on the other hand, payroll employment was 5.1% (-2,600) below its February 2020 employment level. Payroll employment increases in both accommodation and food services and arts, entertainment and recreation, as indoor capacity limits are lifted In the arts, entertainment and recreation sector, which also benefitted from the easing of indoor capacity limits in March, payroll employment increased by 10,400 (+4.0%) in the month. Many of the gains were in amusement, gambling and recreation industries (+7,700; +4.1%). Quebec (+5,900; +11.4%) and Ontario (+2,700; +2.7%) accounted for the majority of the gain. Average weekly earnings increase in March Chart 2: Average weekly earnings growth accelerates in March Of all sectors, utilities recorded the largest year-over-year increase in average weekly earnings in March (+11.7% to $2,011), followed by finance and insurance (+12.1% to $1,625) and professional, scientific and technical services (+8.0% to $1,633). Arts, entertainment and recreation (-4.2% to $693) was the only sector in March to report a year-over-year decrease in average weekly earnings, likely due, in part, to compositional changes in employment resulting from lower-paid employees returning to work following the removal of most capacity limits and proof-of-vaccination requirements in most provinces. Average weekly hours worked essentially unchanged in March Overall job vacancies reach all-time high The job vacancy rate, which measures the number of vacant positions as a proportion of all positions (vacant and filled), was 5.9% in March 2022, matching the record high observed in September 2021 (not seasonally adjusted). Vacancies increase by more than one-third in both accommodation and food services and retail trade There were 109,200 job vacancies in retail trade in March, up 37.2% (+29,600) from February. Following this increase, vacancies in the sector were 40.7% (+31,600) higher than in March 2021 (not seasonally adjusted). Record level of job vacancies in health care and social assistance and in construction The number of vacancies also rose to an unprecedented high (81,900) in the construction sector in March. The increase in the month (+26.6%; +17,200) followed five consecutive monthly declines and the job vacancy rate reached a record high of 7.3%, up 1.3 percentage points from February. Job vacancies up in all provinces There was an average of 1.2 unemployed people for each job vacancy in March, down from 1.4 in February and from 2.6 one year earlier (not seasonally adjusted). This decline coincides with a number of Labour Force Survey indicators which pointed to an increasingly tight labour market in March, including a record-low unemployment rate of 5.3% and a record-high core-age (aged 25 to 54 years) labour force participation rate of 88.6% (data from the Labour Force Survey are seasonally adjusted). The unemployment-to-job vacancy ratios varied across Canada, with the lowest ratios in Quebec (0.8) and British Columbia (0.8), and the highest in Newfoundland and Labrador (4.3). A lower ratio indicates a tighter labour market and possible labour shortages. New data shed light on recent challenges experienced by employers facing labour shortages To shed light on recent trends in job vacancies and account for seasonality, Statistics Canada has developed new experimental data with the goal to remove the effect of seasonal patterns. Based on these data, total job vacancies increased from September to December 2021, consistent with a number of economic and labour market indicators which suggested that employers continued to face significant challenges filling vacant positions in the late fall and early winter 2021. Using these same experimental data, vacancies decreased in January and February 2022, coinciding with tighter public health restrictions, before resuming their increase in March. Statistics Canada is continuing to develop a full time series of seasonally adjusted job vacancy indicators. Chart 3: Job vacancies increase since October 2020 Next release Note to readers Payroll employment, as measured by the SEPH, refers to the number of employees receiving pay or benefits (employment income) during a given month. The survey excludes the self-employed, owners and partners of unincorporated businesses and professional practices, and employees in the agricultural sector. SEPH estimates are produced by integrating information from three sources: a census of approximately 1 million payroll deduction records provided by the Canada Revenue Agency; the Business Payrolls Survey, which collects data from a sample of 15,000 establishments; and administrative records of federal, provincial and territorial public administration employment, provided by these levels of government. Estimates of average weekly earnings and hours worked are based on a sample and are therefore subject to sampling variability. This analysis focuses on differences between estimates that are statistically significant at the 68% confidence level. Payroll employment estimates are based on a census of administrative records and are not subject to sampling variability. With each release of SEPH data, data for the preceding month are revised. Users are encouraged to use the most up-to-date data available for each month. Statistics Canada also produces employment estimates from its Labour Force Survey (LFS). The LFS is a monthly household survey, the main objective of which is to divide the working-age population into three mutually exclusive groups: the employed (including the self-employed), the unemployed and those not in the labour force. This survey is the official source for the unemployment rate, and it collects data on the sociodemographic characteristics of all those in the labour market. As a result of conceptual and methodological differences, estimates of changes from the SEPH and the LFS differ occasionally. However, the trends in the data are similar. For a more in-depth discussion of the conceptual differences between employment measures from the LFS and the SEPH, refer to Section 8 of the Guide to the Survey of Employment, Payrolls and Hours (Catalogue number72-203-G). Unless otherwise stated, this release presents seasonally adjusted data, which facilitate month-to-month comparisons because the effects of seasonal variations are removed. For more information on seasonal adjustment, see Seasonally adjusted data – Frequently asked questions. Non-farm payroll employment data are for all hourly and salaried employees and for the "other employees" category, which includes piece-rate and commission-only employees. Unless otherwise specified, average weekly hours data are for hourly and salaried employees only and exclude businesses that could not be classified to a NAICS code. All earnings data include overtime and exclude businesses that could not be classified to a NAICS code. Earnings data are based on gross taxable payroll before source deductions. Average weekly earnings are derived by dividing total weekly earnings by the number of employees. Job Vacancy and Wage Survey JVWS collection is done on a quarterly basis. The quarterly sample of business locations is allocated to the three collection months of the quarter, approximately balanced by province and by industrial sector across each of the three months. This allows both quarterly and monthly estimates to be produced. The JVWS also provides comprehensive quarterly data on job vacancies by industrial sector and detailed occupation for Canada and the provinces, territories and economic regions; offered hourly wages; and job vacancy characteristics. Quarterly data for the second and third quarters of 2020 are unavailable because survey operations were temporarily suspended during the COVID-19 pandemic. More information about the concepts and use of data from the JVWS is available in the Guide to the Job Vacancy and Wage Survey (Catalogue number75-514-G). Preliminary monthly estimates are produced for job vacancies, job vacancy rates and payroll employment using available responses from business locations sampled in the corresponding reference month. The reference period for the JVWS is the first day of the respective month. These preliminary monthly estimates are revised and finalized when the corresponding quarterly estimates are released or shortly thereafter. Users are encouraged to use the most up-to-date data available for each month. JVWS estimates are not seasonally adjusted. Therefore, month-to-month and quarter-to-quarter comparisons should be interpreted with caution as they may reflect seasonal movements. New experimental data adjusted for seasonality are derived from ongoing work to develop seasonally adjusted JVWS time series. Further information on this ongoing work is available on request. While JVWS employment is calibrated to the SEPH, SEPH payroll employment and JVWS preliminary monthly employment figures may differ because of calibration grouping and differences in scope and reference period. Labour Force Survey data used in this Daily release to calculate the unemployment-to-job vacancy ratios are non-seasonally adjusted (unless otherwise indicated). Real-time data tables Next release Products The product "Earnings and payroll employment in brief: Interactive app" (14-20-0001) is now available. This interactive data visualization application provides a comprehensive picture of the Canadian labour market using the most recent data from the Survey of Employment, Payrolls and Hours. The estimates are seasonally adjusted and available by province and largest industrial sector. Historical estimates going back 10 years are also included. The interactive application allows users to quickly and easily explore and personalize the information presented. Combine multiple provinces and industrial sectors to create your own labour market domains of interest. Contact information Industry Intelligence Editor's Note: This press release omits select charts and/or marketing language for editorial clarity. Click here to view the full report.
In March, seven provinces recorded payroll employment increases, while there was little change in Manitoba, Nova Scotia and Saskatchewan. All provinces, with the exception of Alberta (-12,700; -0.6%) and Newfoundland and Labrador (-1,700; -0.8%), had, in March, surpassed their payroll employment level in February 2020, before the COVID-19 pandemic.
Payroll employment in retail trade rose by 14,800 (+0.7%) in March, and, for the first time, surpassed its pre-pandemic level, increasing by 9,600 (+0.5%) compared with February 2020. Payroll employment in the sector was either on par with or higher than in February 2020 in all provinces in March 2022, with the exception of Ontario (-5,400; -0.7%) and Manitoba (-2,100; -3.0%).
Payroll employment increased in the accommodation and food services sector (+46,200; +4.0%) in March 2022. Gains were mainly attributed to food services and drinking places (+39,500; +4.0%). Quebec (+20,400; +9.1%) and Ontario (+15,800; +3.8%) were the source of over three-quarters of the gain.
Average weekly earnings, derived by dividing total weekly earnings by the total number of payroll employees, were $1,170 in March, up 0.9% compared with February. On a year-over-year basis, average weekly earnings increased 4.3% in March, while the Consumer Price Index increased 6.7% during the same period. The March year-over-year increase (+4.3%) was more than double the year-over-year increase observed in February (+2.1%) and January (+2.1%). In general, changes in average weekly earnings can be the result of a number of factors, including wage growth, and special payments such as bonuses, changes in the composition of employment and average hours worked per week.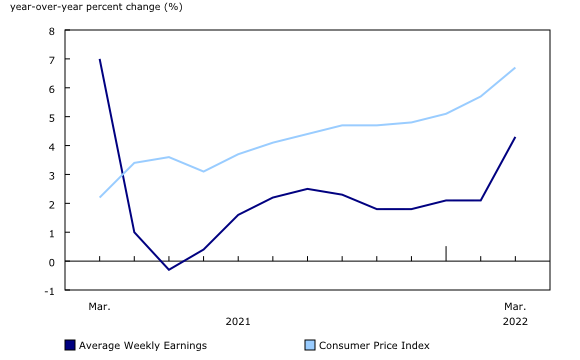
Average weekly hours worked were little changed in March. Hourly paid employees worked an average of 31.3 hours per week, up 2.5% from the pre-pandemic level, while salaried employees worked 37.1 hours per week, up 0.7% compared with February 2020.
Across all sectors, Canadian employers were actively seeking to fill more than one million (1,012,900) vacant positions at the beginning of March 2022, a record high. Vacancies increased by 22.6% (+186,400) in the month and were up 60.5% (+382,000) from March 2021 (not seasonally adjusted).
In the accommodation and food services sector, the number of vacancies rose 37.2% (+42,900) in March 2022. Following this increase, employers were seeking to fill a total of 158,100 positions. The job vacancy rate was 12.8%, the highest across all sectors for the 11th consecutive month (not seasonally adjusted).
Employers in health care and social assistance were seeking to fill a record-high 154,500 vacant positions in March 2022, up 16.0% (+21,300) from February. The job vacancy rate climbed to a new high of 6.6% in March after plateauing at 5.8% during the previous three months.
On a month-over-month basis, job vacancies increased in all provinces in March. Proportionally, the largest increases were in Saskatchewan (+49.4% to 26,600), Nova Scotia (+45.6% to 23,000), and Newfoundland and Labrador (+43.1% to 8,300). The number of vacancies reached a record high in Nova Scotia (23,000), Manitoba (30,000), Saskatchewan (26,600), and British Columbia (178,300).
Before increasing to over one million (1,012,900) in March 2022, job vacancies had fallen for five consecutive months from a previous high of 988,300 in September 2021. Labour demand varies over the course of the year influenced by seasonal patterns with increased economic activity typically driving higher demand for labour in the spring and summer and lower demand in the winter. These seasonal effects are reflected in the five months of consecutive decreases in job vacancies from October 2021 to February 2022.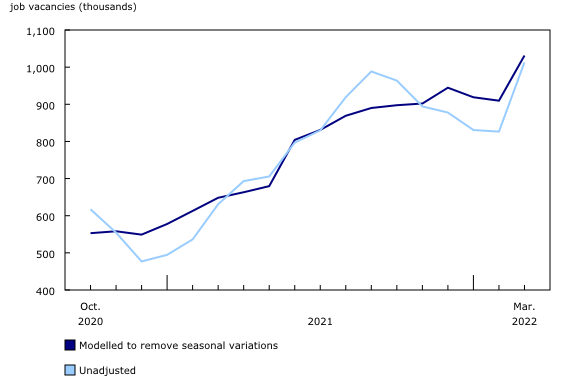
April 2022 data for SEPH and Job Vacancy and Wage Survey (JVWS) will be released on June 24, 2022. First quarter of 2022 (January to March) JVWS results, which will also provide insights into job vacancies by subsector, vacancies by occupation and offered wages, will be released on June 21, 2022.
Survey of Employment, Payrolls and Hours
The key objective of the Survey of Employment, Payrolls and Hours (SEPH) is to provide a monthly portrait of the level of earnings, employment and hours worked, by detailed industry, at the national, provincial and territorial levels.
Beginning with the release of October 2020 data, preliminary monthly estimates from the Job Vacancy and Wage Survey (JVWS) are published on a monthly basis. These estimates provide more timely information on the number of job vacancies and the job vacancy rate by province and by industrial sector.
Real-time data tables 14-10-0357-01, 14-10-0358-01, 14-10-0331-01 and 14-10-0332-01 will be updated on June 13, 2022.
Data on payroll employment, earnings and hours, and job vacancies for April 2022 will be released on June 24, 2022.
More information about the concepts and use of the Survey of Employment, Payrolls and Hours is available in the Guide to the Survey of Employment, Payrolls and Hours (Catalogue number72-203-G).
For more information, or to enquire about the concepts, methods or data quality of this release, contact us (toll-free 1-800-263-1136; 514-283-8300; infostats@statcan.gc.ca) or Media Relations (statcan.mediahotline-ligneinfomedias.statcan@statcan.gc.ca).
* All content is copyrighted by Industry Intelligence, or the original respective author or source. You may not recirculate, redistrubte or publish the analysis and presentation included in the service without Industry Intelligence's prior written consent. Please review our terms of use.


