OTTAWA
,
October 26, 2023
(press release)
–
The number of employees receiving pay and benefits from their employer—measured as "payroll employment" in the Survey of Employment, Payrolls and Hours—declined by 46,800 (-0.3%) in August, following little change in July. Meanwhile, job vacancies remained on a downward trend, edging down from 697,900 in July to 682,400 in August. Chart 1: Payroll employment declines in August Construction (-22,300; -1.9%) recorded the largest payroll employment decline in August, followed by manufacturing (-4,500; -0.3%), retail trade (-4,300; -0.2%), administrative and support, waste management and remediation services (-4,000; -0.5%), information and cultural industries (-2,800; -0.8%), and accommodation and food services (-2,800; -0.2%). These monthly declines were mitigated by payroll employment gains in August in public administration (+7,400; +0.6%), health care and social assistance (+4,500; +0.2%), and finance and insurance (+4,100; +0.5%). Little change was observed in the remaining 11 sectors. Chart 2: Overall payroll employment decline in August largely concentrated in construction Payroll employment in construction declines for the first time since March 2023 The monthly decrease in August 2023 was concentrated in specialty trade contractors (-13,000; -1.9%), including building equipment contractors (-4,600; -1.5%) and foundation, structure and building exterior contractors (-4,000; -3.0%). Declines were also recorded in non-residential building construction (-3,900; -3.1%), heavy and civil engineering construction (-3,700; -2.0%) and residential building construction (-1,700; -1.0%). Payroll employment in retail trade declines in August The decline in retail trade in August offset a net gain of 3,900 (+0.2%) from March to July. As a result, payroll employment in August in retail trade was on par with the level recorded in March. Payroll employment in manufacturing declines for the second consecutive month The overall decline in August was primarily concentrated in fabricated metal product manufacturing (-2,000; -1.2%), and beverage and tobacco product manufacturing (-1,200; -2.1%). Hospitals drive growth in healthcare and social assistance in August The monthly gain in the sector in August 2023 was concentrated in hospitals (+6,200; +0.9%) and was dampened by a decline in ambulatory healthcare services (-2,200; -0.3%). Hospitals have recorded steady growth in payroll employment since April, with a cumulative gain of 18,400 (+2.7%) from April to August. Average weekly earnings are little changed in August In August, average weekly hours (33.4 hours) were essentially unchanged compared with both the previous month and August 2022. Job vacancies edge down in August Total labour demand (the sum of filled and vacant positions) in August 2023 was little changed compared with the beginning of the year, as job vacancies have fallen by 181,700 (-21.0%) over the period, while payroll employment has increased by 162,300 (+1.0%). The largest monthly declines in vacancies in August were observed in manufacturing (-5,900; -11.5%), followed by information and cultural industries (-3,300; -36.7%), utilities (-1,700; -54.7%) and agriculture, forestry, fishing and hunting (-1,700; -16.8%). These decreases were partially offset by an increase in vacancies in finance and insurance (+4,400; +20.4%) and management of companies and enterprises (+700; +32.5%). The number of unfilled positions was little changed in the remaining 14 sectors. In August, on a year-over-year basis, vacant positions were down in 17 of 20 sectors, led by retail trade (-38,800; -36.0%), accommodation and food services (-38,700; -31.4%), manufacturing (-35,700; -44.1%), and professional, scientific and technical services (-20,700; -32.9%). Meanwhile, job vacancies in health care and social assistance (136,000) were virtually unchanged from August 2022 and remained the highest across all sectors in August 2023. Job vacancies also showed little year-over-year variation in August in public administration, and mining, quarrying, and oil and gas extraction. The job vacancy rate—which corresponds to the number of vacant positions as a proportion of total labour demand—was 3.8% in August, virtually unchanged compared with July (3.9%), but down from 4.8% observed at the start of the year. This decline in the job vacancy rate since January reflects the declines in vacancies (-181,700; -21.0%) combined with gains in payroll employment (+162,300; +1.0%). Infographic 1: Job vacancies and job vacancy rate remain on a downward trend in August While job vacancies edged down in August, the number of unemployed persons (from the Labour Force Survey) showed little variation in the month. There were 1.7 unemployed persons for every job vacancy in August, matching the ratio seen in July, but up from 1.3 in February, March and April. Manufacturing records the lowest number of vacancies since March 2020 The job vacancy rate in the sector was 2.8% in August, down by 0.3 percentage points from July, and down by 0.7 percentage points from June. The decrease in the job vacancy rate since June was driven by the fall in job vacancies (-10,800; -19.3%), as payroll employment showed little variation over this period. Job vacancies up in finance and insurance Chart 3: Declines in the number of job vacancies since August 2022 have been broad-based Job vacancies fall in three provinces and rise in Alberta On a year-over-year basis, the job vacancy rate decreased in August in nine provinces and was little changed in Saskatchewan. Prince Edward Island (-3.8 percentage points to 2.7%) recorded the largest year-over-year decline in August, followed by Quebec (-1.7 percentage points to 4.0%), British Columbia (-1.6 percentage points to 4.2%) and Ontario (-1.4 percentage points to 3.6%). In August, the job vacancy rate was highest in Saskatchewan (4.7%) and British Columbia (4.2%), while it was lowest in Prince Edward Island (2.7%) and Newfoundland and Labrador (2.9%). Note to readers Payroll employment, as measured by the SEPH, refers to the number of employees receiving pay and benefits (employment income) during a given month. The survey excludes the self-employed, owners and partners of unincorporated businesses and professional practices, and employees in the agricultural sector. SEPH estimates are produced by integrating information from three sources: a census of approximately 1 million payroll deduction records provided by the Canada Revenue Agency; the Business Payrolls Survey, which collects data from a sample of 15,000 establishments; and administrative records of federal, provincial and territorial public administration employment, provided by these levels of government. Estimates of average weekly earnings and hours worked are based on a sample and are therefore subject to sampling variability. This analysis focuses on differences between estimates that are statistically significant at the 68% confidence level. Payroll employment estimates are based on a census of administrative records and are not subject to sampling variability. With each release of SEPH data, data for the preceding month are revised. Users are encouraged to use the most up-to-date data available for each month. Statistics Canada also produces employment estimates from its Labour Force Survey (LFS). The LFS is a monthly household survey, the main objective of which is to divide the working-age population into three mutually exclusive groups: the employed (including the self-employed), the unemployed and those not in the labour force. This survey is the official source for the unemployment rate, and it collects data on the sociodemographic characteristics of all those in the labour market. As a result of conceptual and methodological differences, estimates of changes from the SEPH and the LFS differ occasionally. However, the trends in the data are similar. For a more in-depth discussion of the conceptual differences between employment measures from the LFS and the SEPH, refer to Section 8 of the Guide to the Survey of Employment, Payrolls and Hours (Catalogue number72-203-G). Unless otherwise stated, this release presents seasonally adjusted data, which facilitate comparisons because the effects of seasonal variations are removed. For more information on seasonal adjustment, see Seasonally adjusted data – Frequently asked questions. Non-farm payroll employment data are for all hourly and salaried employees and for the "other employees" category, which includes piece-rate and commission-only employees. Unless otherwise specified, average weekly hours data are for hourly and salaried employees only and exclude businesses that could not be classified to a North American Industry Classification System (NAICS) code. All earnings data include overtime and exclude businesses that could not be classified to a NAICS code. Earnings data are based on gross taxable payroll before source deductions. Average weekly earnings are derived by dividing total weekly earnings by the number of employees. Job Vacancy and Wage Survey Preliminary monthly estimates are produced for job vacancies, job vacancy rates and payroll employment using available responses from business locations sampled in the corresponding reference month. The reference period for the JVWS is the first day of the respective month. These preliminary monthly estimates are revised and finalized when the corresponding quarterly estimates are released or shortly thereafter. Users are encouraged to use the most up-to-date data available for each month. Unless otherwise stated, this release presents seasonally adjusted data, which facilitate comparisons because the effects of seasonal variations are removed. For more information on seasonal adjustment, see Seasonally adjusted data – Frequently asked questions. While JVWS employment is calibrated to the SEPH, SEPH payroll employment and JVWS preliminary monthly employment figures may differ because of calibration grouping and differences in scope and reference period. The JVWS also provides comprehensive quarterly data on job vacancies by industrial sector and detailed occupation for Canada and the provinces, territories and economic regions; offered hourly wages; and job vacancy characteristics. More information about the concepts and use of data from the JVWS is available in the Guide to the Job Vacancy and Wage Survey (Catalogue number75-514-G). Real-time data tables Next release Products The product "Earnings and payroll employment in brief: Interactive app" (Catalogue number14200001) is now available. This interactive data visualization application provides a comprehensive picture of the Canadian labour market using the most recent data from the Survey of Employment, Payrolls and Hours. The estimates are seasonally adjusted and available by province and largest industrial sector. Historical estimates that go back 10 years are also included. The interactive application allows users to explore and personalize the information presented quickly and easily. Combine multiple provinces and industrial sectors to create your own labour market domains of interest. Contact information Industry Intelligence Editor's Note: This press release omits select charts and/or marketing language for editorial clarity. Click here to view the full report. 
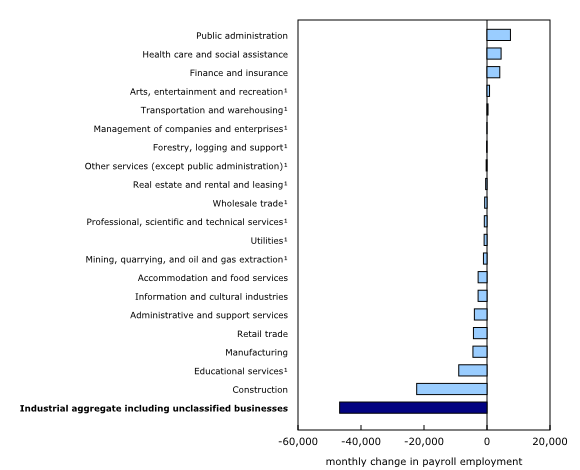
In August, payroll employment in construction (-22,300; -1.9%) declined for the first time since March. Overall growth in construction has slowed in 2023, following stronger gains in the second half of 2022. The sector recorded a net decline of 5,400 (-0.5%) from December 2022 to August 2023, compared with an increase of 23,800 (+2.1%) from July to December 2022.
In August, payroll employment in retail trade declined by 4,300 (-0.2%). The overall monthly decline in retail trade was generally broad-based across subsectors but tempered by an increase in food and beverage retailers (+5,000; +0.9%). Multiple subsectors recorded declines in August including clothing, clothing accessories, shoes, jewelry, luggage and leather goods retailers (-3,800; -1.8%), health and personal care retailers (-3,400; -1.6%), and building material and garden equipment and supplies dealers (-1,100; -0.8%).
Payroll employment in manufacturing (-4,500; -0.3%) declined for the second month in a row, bringing cumulative losses in July and August to 10,600 (-0.7%). This follows a period of relatively strong growth from March to June (+13,200; +0.8%).
Payroll employment in healthcare and social assistance increased by 4,500 (+0.2%) in August, continuing an upward trend since September 2022.
In August, average weekly earnings were $1,218, little changed compared with the previous month. On a year-over-year basis, growth in average weekly earnings was 4.2% in both July and August. In general, growth in average weekly earnings can reflect a range of factors, including changes in wages, composition of employment and hours worked.
Job vacancies remained on a downward trend in August 2023, edging down to 682,400 from 697,900 in July. Job vacancies in August were at their lowest level since May 2021 (673,400).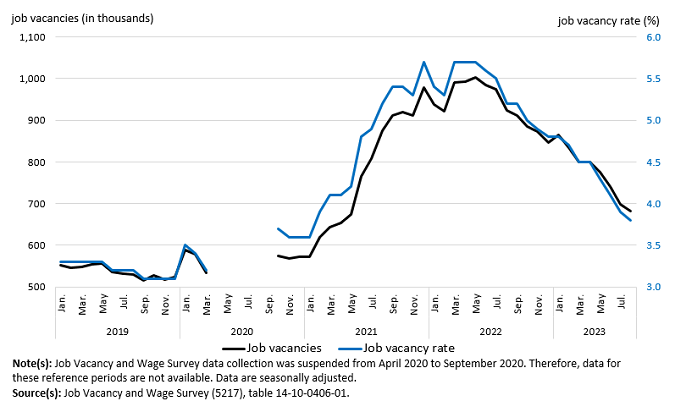
The number of job vacancies in manufacturing fell by 5,900 (-11.5%) to reach 45,300 in August, the lowest level since March 2020 (41,500). The decline in August 2023 follows a similar decline in July (-5,000; -8.9%).
In finance and insurance, job vacancies rose by 4,400 (+20.4%) to 25,700 in August, following little change in July and partially offsetting the decrease recorded in June (-9,100; -31.1%). As a result, the job vacancy rate was up by 0.5 percentage points to 3.0% in August, but it was little changed compared with the rate seen in May (3.4%).
In Quebec, the number of vacancies fell by 19,300 (-10.8%) to 159,000 in August, the third monthly decrease in four months, bringing the cumulative decline to 43,900 (-21.6%) since May. Manitoba (-2,700 to 20,600) and Prince Edward Island (-800 to 1,900) also recorded decreases in job vacancies in August. Meanwhile, job vacancies increased in Alberta (+7,500 to 88,700), while they showed little change in the other provinces.
Survey of Employment, Payrolls and Hours
The key objective of the Survey of Employment, Payrolls and Hours (SEPH) is to provide a monthly portrait of the level of earnings, employment and hours worked, by detailed industry, at the national, provincial and territorial levels.
Job Vacancy and Wage Survey (JVWS) collection is done on a quarterly basis. The quarterly sample of business locations is allocated to the three collection months of the quarter, approximately balanced by province and by industrial sector across each of the three months. This allows both quarterly and monthly estimates to be produced.
Real-time data tables 14-10-0331-01, 14-10-0332-01 and 14-10-0357-01 will be updated on November 13.
September data for the SEPH and the JVWS will be released on November 30.
More information about the concepts and use of the Survey of Employment, Payrolls and Hours is available in the Guide to the Survey of Employment, Payrolls and Hours (Catalogue number72-203-G).
For more information, or to enquire about the concepts, methods or data quality of this release, contact us (toll-free 1-800-263-1136; 514-283-8300; infostats@statcan.gc.ca) or Media Relations (statcan.mediahotline-ligneinfomedias.statcan@statcan.gc.ca).
* All content is copyrighted by Industry Intelligence, or the original respective author or source. You may not recirculate, redistrubte or publish the analysis and presentation included in the service without Industry Intelligence's prior written consent. Please review our terms of use.


