OTTAWA
,
September 9, 2022
(press release)
–
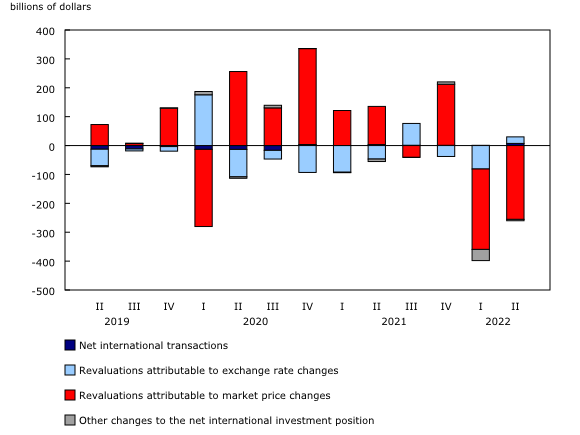
Canada's net foreign asset position, the difference between Canada's international financial assets and international liabilities, was down by $230.2 billion to $875.1 billion at the end of the second quarter. This was a second significant consecutive quarterly decline. Both international assets and liabilities decreased substantially in the quarter as global equity markets fell sharply. In the first half of 2022, Canada's net foreign asset position fell by $627.6 billion, from the record high reached at the end of 2021. The revaluation effect resulting from market price changes (-$255.5 billion) contributed the most to the decrease in Canada's net foreign asset position. Over the quarter, the Canadian stock market contracted by 12.2%, the US stock market lost 14.1%, and the European stock market was down 9.9%. This resulted in substantial declines in the value of both Canada's international assets and liabilities in the form of equity instruments, with assets being more impacted as equities account for a much higher share of assets than liabilities. Chart 1: Canada's net international investment position The revaluation effect from fluctuations in exchange rates (+$22.6 billion) moderated the overall decrease in Canada's net foreign asset position. Over the quarter, the Canadian dollar lost 3.0% against the US dollar while it gained 4.8% against the UK pound sterling, 2.9% against the euro, and 8.5% against the Japanese yen. At the end of the second quarter, 96.7% of Canada's international assets were denominated in foreign currencies, compared with 37.5% of its international liabilities. The US dollar was the most important foreign currency of denomination for both international assets and liabilities. On a geographical basis, Canada's net asset position with the United States was down $31.8 billion to $802.5 billion and was down $198.5 billion to $72.6 billion with the rest of the world at the end of the second quarter. Chart 2: Contributors to the change in the net international investment position Canada's international assets and liabilities decrease on lower equity prices On the other side of the ledger, Canada's international liabilities were down by $321.1 billion (-5.1%) to $5,942.8 billion at the end of the second quarter, the largest percentage decrease since the first quarter of 2020. The decrease mainly resulted from lower Canadian equity prices. This decline was moderated by inflows of funds from abroad (+$77.5 billion) and, to a lesser extent, upward revaluation effect of the weaker Canadian dollar (+$37.0 billion). At the end of the second quarter, Canada's international liabilities denominated in foreign currencies were up by $74.1 billion to $2,228.7 billion and represented 37.5% of Canada's total international liabilities. Chart 3: Canada's international assets and liabilities Canada's gross external debt increases The financial sector—mainly deposit-taking corporations—saw its gross external debt increase by $103.4 billion to $1,475.0 billion. At the end of June, the financial sector still contributed to the highest proportion of Canada's gross external debt (59.3%), followed by the government sector (18.6%). The government sector's gross external debt decreased by $46.7 billion to $601.3 billion. A decline in foreign holdings of debt securities in the form of bonds (-$28.2 billion) and money market instruments (-$18.4 billion) contributed to the contraction. While the decline in money market instruments was mainly attributable to retirements, the decrease in bonds was mostly due to the valuation changes resulting from higher interest rates. Chart 4: Canada's gross external debt as a percentage of gross domestic product Note to readers Canada's net international investment position is the difference between Canada's assets and liabilities to the rest of the world. An excess of international liabilities over international assets can be referred to as Canada's net foreign debt. An excess of international assets over international liabilities can be referred to as Canada's net foreign assets. Foreign direct investment is presented on an asset–liability principle basis (that is, a gross basis) in the international investment position. Foreign direct investment can also be presented on a directional principle basis (that is, a net basis), as shown in supplementary foreign direct investment tables 36-10-0008-01, 36-10-0009-01 and 36-10-0659-01. The difference between the two foreign direct investment conceptual presentations resides in the classification of reverse investment such as (1) Canadian affiliates' claims on foreign parents, and (2) Canadian parents' liabilities to foreign affiliates. Under the asset–liability presentation, (1) is classified as an asset and included in direct investment assets, and (2) is classified as a liability and included in direct investment liabilities. Next release Products The Canada and the World Statistics Hub (Catalogue number13-609-X) is available online. This product illustrates the nature and extent of Canada's economic and financial relationship with the world through interactive graphs and tables. This product provides easy access to information on trade, investment, employment and travel between Canada and a number of countries, including the United States, the United Kingdom, Mexico, China, and Japan. The product Canada's international trade and investment country fact sheet (Catalogue number71-607-X) is available online. This product provides easy and centralized access to Canada's international trade and investment statistics, on a country-by-country basis. It contains annual information for nearly 250 trading partners in summary form, including charts, tables and a short analysis that can also be exported in PDF format. The Methodological Guide: Canadian System of Macroeconomic Accounts (Catalogue number13-607-X) is available. The User Guide: Canadian System of Macroeconomic Accounts (Catalogue number13-606-G) is also available. Contact information Industry Intelligence Editor's Note: This press release omits select charts and/or marketing language for editorial clarity. Click here to view the full report. 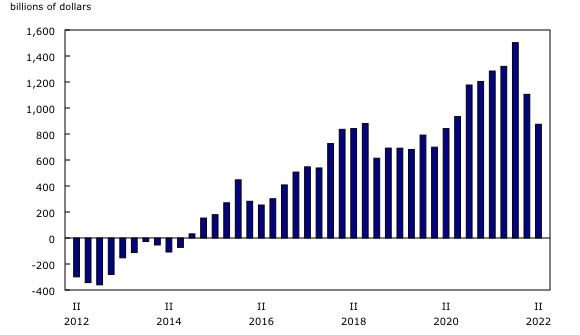
Canada's international assets were down by $551.3 billion (-7.5%) to $6,817.9 billion at the end of the second quarter, the largest percentage decrease since the third quarter of 2008, at the time of a global financial crisis. The decrease was largely attributable to the decline in foreign stock prices, especially in the US market. New investments abroad (+$84.9 billion), mainly in the form of direct investment and, to a lesser degree, the revaluation due to exchange rate movements (+$59.6 billion), moderated the decrease.
Canada's gross external debt, or the value of Canadian debt instruments held by foreign investors, was up by $23.5 billion to $3,239.7 billion at the end of the second quarter. It amounted to 115.2% of the gross domestic product, continuing a downward trend from a high of 150.5% at the end of the second quarter of 2020. This proportion was at 123.4% at the end of 2019, before the COVID-19 pandemic.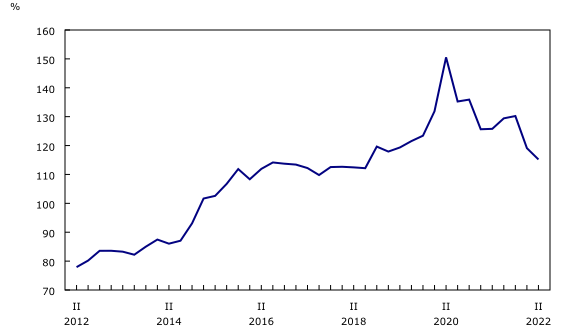
Definitions
The international investment position is the value and composition of Canada's assets and liabilities to the rest of the world.
International investment position data for the third quarter of 2022 will be released on December 9, 2022.
The Economic accounts statistics and International trade statistics portals are available from the Subjects module of the Statistics Canada website.
For more information, or to enquire about the concepts, methods or data quality of this release, contact us (toll-free 1-800-263-1136; 514-283-8300; infostats@statcan.gc.ca) or Media Relations (statcan.mediahotline-ligneinfomedias.statcan@statcan.gc.ca).
* All content is copyrighted by Industry Intelligence, or the original respective author or source. You may not recirculate, redistrubte or publish the analysis and presentation included in the service without Industry Intelligence's prior written consent. Please review our terms of use.


