OTTAWA
,
September 13, 2023
(press release)
–
Household net worth rises with gains in both non-financial and financial assets Despite higher saving rate, deposits stall and households divest from mutual funds Highlights The household saving rate rose in the second quarter as household disposable income increased at more than twice the pace of household consumption expenditure. The Bank of Canada, after two pauses earlier in the year, increased the policy interest rate to 4.75% in June and 5% in July. Amidst a higher rate environment, household mortgage borrowing activity decelerated for a fourth consecutive quarter in the second quarter, although the housing market continued to rebound. Households took advantage of higher rates by continuing to invest in fixed-term deposits and money market mutual funds, albeit at a slower rate. Federal government interest costs increased over the quarter, as it recorded its largest net issuance of debt in two years, with interest rates on newly issued debt exceeding that of maturing debt. Canada's net foreign asset position improved again as global equity markets, particularly in the United States, continued to show strength despite higher interest rates. Meanwhile, the Canadian corporate sector reduced its net demand for funds. Residential real estate prices continue to grow in the face of rising interest rates While the resale market remained active, the volume of housing investment declined 2.1% in the second quarter of 2023, the fifth consecutive quarterly decline on a seasonally adjusted basis. The decrease was led by a sharp drop in new construction (-8.2%). Households borrow less in light of higher interest rates The seasonally adjusted stock of household credit market debt (consumer credit, and mortgage and non-mortgage loans) grew 0.6% from the first quarter of 2023 to reach $2,861.1 billion in the second quarter, with mortgage debt ($2,126.2 billion) accounting for almost three-quarters of the total outstanding debt. Chart 1: Household credit market debt, seasonally adjusted flows Households' debt service costs and credit market leverage helped by stronger disposable incomes Chart 2: Household credit market debt to household disposable income, seasonally adjusted The household debt service ratio, measured as total obligated payments of principal and interest on credit market debt as a proportion of household disposable income, stood at 14.79% in the second quarter, dropping from 14.90% in the first quarter, which was the highest point since 2019. Stronger growth in aggregate disposable income helped deflate the ratio; however, income gains are not equally shared among all income brackets. Chart 3: Household debt service ratio Meanwhile, mortgage interest payments continued to climb, increasing 5.0% from the first quarter of 2023, a relative slowdown compared with the four consecutive quarters of double-digit growth that preceded it. This was accompanied by a continued decline in mortgage principal payments (-1.1%) in the second quarter, as interest continued to account for a greater share of households' total mortgage payments, albeit at a much slower pace. Federal government borrowing reaches highest level in two years The Bank of Canada continued its quantitative tightening program, with the central bank allowing $22.8 billion worth of federal government debt to mature without replacement in the second quarter. Non-residents stepped in to purchase $33.2 billion in federal government securities, demonstrating robust international demand for short term Canadian federal government debt. Uptick in federal government net financial liabilities as a proportion of gross domestic product Chart 4: Government net financial liabilities as a percentage of gross domestic product Private non-financial corporations' demand for funds decelerates amidst record net redemption of listed shares Chart 5: Demand for funds by private non-financial corporations Chartered banks play key role meeting domestic demand for funds Chart 6: Domestic demand for funds by instrument National net worth increases on expanding international investment position Chart 7: Change in national net worth by component The total value of non-financial assets in Canada, also referred to as national wealth, rose 0.9% in the second quarter of 2023 to $16,108.8 billion. Most of the increase was due to real estate, which rose 1.5%, bolstered by the continued rebound in house prices. On the other hand, the value of natural resources (excluding land) declined 3.1%, losing almost half of the value (-48.6%) from the peak in the second quarter of 2022 as energy prices have declined. Canada's net foreign asset position, the difference between Canada's international financial assets and international liabilities, increased by $162.2 billion to reach $1,256.0 billion in the second quarter of 2023, led by significant market price gains from strong equity markets in the United States. The net foreign asset position buoyed national net worth by $607.1 billion over the last four quarters, while national wealth fell $1,046.0 billion over the same period. Note to readers Data enhancements to the national balance sheet and financial flow accounts, such as the development of detailed counterparty information by sector, will be incorporated on an ongoing basis. To facilitate this initiative as well as others, it is necessary to extend the annual revision period (normally the previous three years) at the time of the third quarter release. Consequently, with the third quarter release of the financial and wealth accounts, data will be revised back to 1990 to ensure a continuous time series. Support measures by governments Financial and wealth accounts on a from-whom-to-whom basis: Selected financial instruments Next release Overview of the financial and wealth accounts The NBSA are composed of the balance sheets of all sectors and subsectors of the economy. The main sectors are households, non-profit institutions serving households, financial corporations, non-financial corporations, government, and non-residents. The NBSA cover all national non-financial assets and all financial asset-liability claims outstanding in all sectors. To improve the interpretability of financial flows data, selected household borrowing series are available on a seasonally adjusted basis (table 38-10-0238-01). All other data are unadjusted for seasonal variation. For information on seasonal adjustment, see Seasonally adjusted data – Frequently asked questions. The FFA articulate net lending or borrowing activity by sector by measuring financial transactions in the economy. The FFA arrive at a measure of net financial investment, which is the difference between transactions in financial assets and liabilities (for example, net purchases of securities less net issuances of securities). The FFA also provide the link between financial and non-financial activity in the economy, which ties estimates of saving and non-financial capital acquisition (for example, investment in new housing) to the underlying financial transactions. While the FFA record changes in financial assets and liabilities between opening and closing balance sheets that are associated with transactions during the accounting period, the value of assets and liabilities held by an institution can also change for other reasons. These other types of changes, referred to as other economic flows, are recorded in the other changes in assets account. There are two main components to this account. One is the other changes in the volume of assets account. This account includes changes in non-financial and financial assets and liabilities relating to the economic appearance and disappearance of assets, the effects of external events such as wars or catastrophes on the value of assets, and changes in the classification and structure of assets. The other main component is the revaluation account, showing holding gains or losses accruing to the owners of non-financial and financial assets and liabilities during the accounting period as a result of changes in market price valuations. At present, only the aggregate other change in assets is available within the Canadian System of Macroeconomic Accounts; no details are available on the different components. Definitions concerning financial indicators can be found in "Financial indicators from the National Balance Sheet Accounts" and in the Canadian System of Macroeconomic Accounts glossary. Distributions of household economic accounts The methodology for Distributions of household economic accounts wealth estimates can be found in the article "Distributions of Household Economic Accounts, estimates of asset, liability and net worth distributions, 2010 to 2019, technical methodology and quality report." Products The data visualization product "Financial accounts on a from-whom-to-whom basis, selected financial instruments," which is part of Statistics Canada – Data Visualization Products (Catalogue number71-607-X), is now available. As a complement to this release, you can also consult the data visualization product "Distributions of Household Economic Accounts, Wealth: Interactive tool," which is part of Statistics Canada – Data Visualization Products (Catalogue number71-607-X). As a complement to this release, you can also consult the data visualization product "Securities statistics," which is part of Statistics Canada – Data Visualization Products (Catalogue number71-607-X). The Economic accounts statistics portal, accessible from the Subjects module of our website, features an up-to-date portrait of national and provincial economies and their structure. The User Guide: Canadian System of Macroeconomic Accounts (Catalogue number13-606-G) is available. The Methodological Guide: Canadian System of Macroeconomic Accounts (Catalogue number13-607-X) is available. The Canada: Economic and Financial Data - International Monetary Fund's Special Data Dissemination Standard Plus product (Catalogue number13-608-X), "Other Financial Corporations Survey," also known as "Assets and liabilities of other financial corporations by sector, market value, quarterly" (36-10-0668-01), are available. Contact information Industry Intelligence Editor's Note: This press release omits select charts and/or marketing language for editorial clarity. Click here to view the full report.
Household sector net worth—the value of all assets minus all liabilities—rose $256.4 billion or 1.6% to reach $15,970.1 billion in the second quarter. The value of real estate continued its recovery from the sharp declines that began in the second quarter of 2022, while foreign equity markets outpaced domestic markets, as an 8.3% rise in the Standard and Poor's (S&P) 500 Index dwarfed a 0.3% uptick in the S&P/TSX Composite Index in the second quarter of 2023. The value of households' total financial assets grew 1.3% (+$121.2 billion) in the second quarter, while the value of total non-financial assets rose 1.9% (+$171.7 billion). On the other side of the ledger, financial liabilities, composed primarily of mortgage and non-mortgage debt, increased $36.6 billion from the first quarter.
While the household saving rate reached 5.1% on a seasonally adjusted basis in the second quarter, household holdings of Canadian currency and deposits (unadjusted) grew at the slowest pace (+0.7%) since the first quarter of 2021. Despite this sluggish growth, the value of fixed term deposits at chartered banks continued to grow, rising 3.6% in the second quarter of 2023 while other deposits fell 1.2%. At the same time, households recorded net redemptions in mutual funds of $6.6 billion in the quarter despite the continued inflows into money market funds, which benefit from higher interest rates. Over the last five quarters, households have recorded net redemptions of mutual fund investments totalling $35.1 billion.
The Canadian economy was flat during the second quarter, as an increase in the nominal gross domestic product (GDP) was matched by inflation. On a real basis, net imports rose, while household consumption and inventory accumulation decelerated, and housing investment continued to decline. This was partially offset by higher government spending and business investment in engineering structures. The business outlook deteriorated compared with the first quarter with elevated worries regarding supply chain challenges and inflation.
The value of household residential real estate rose, up 2.0% (+$159.0 billion) during the second quarter, as prices increased during a traditionally strong time of year for real estate activity. The value of residential real estate continued its rebound which started in the first quarter of 2023, and which followed three consecutive quarters of notable declines that closed out 2022. The average resale sales price jumped 8.1% in the second quarter of 2023 to reach $720,346, although prices began to dip entering the summer months. On a seasonally adjusted basis, the total value of resale sales increased 22.3% in the second quarter, while ownership transfer costs, which reflect both new sales and resale activity, posted the first increase since the end of 2021.
During the second quarter, the pace of seasonally adjusted household credit market borrowing continued to decelerate as households demanded $17.1 billion in funds, down from $20.4 billion in the previous quarter. This was the second-lowest level of quarterly household borrowing since 2003, trailing only the second quarter of 2020, and extending a trend of muted borrowing over the last three quarters. The slower borrowing was largely a result of a decline in demand for mortgage loans, which fell to the lowest point since 2005.
On a seasonally adjusted basis, household credit market debt as a proportion of household disposable income fell to 180.5% in the second quarter from 184.2% in the first quarter, as growth in household disposable income (+2.6%) comfortably outpaced that of credit market debt. In other words, there was $1.81 in credit market debt for every dollar of household disposable income in the second quarter.

In the second quarter, the federal government's demand for funds rose to $28.2 billion, its highest level in two years, driven by net issuances in treasury bills (+$25.1 billion). As interest costs for the government continue to rise, the effective interest cost on federal government debt increased substantially in the quarter with maturing debt reissued at higher rates.
The ratio of federal government net financial liabilities to gross domestic product (GDP) increased to 33.1% in the second quarter from 32.8% in the first quarter as net financial liabilities increased modestly. This was the first increase in the ratio after six consecutive quarters of declines.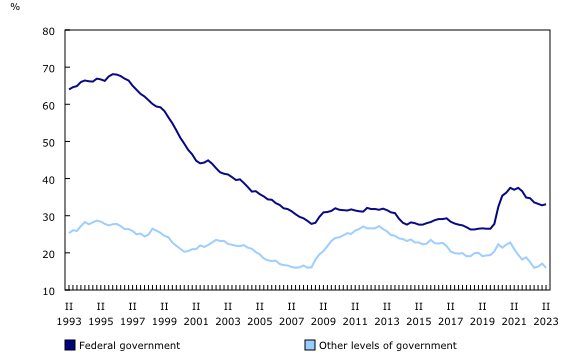
In the second quarter, the demand for funds by private non-financial corporations decreased to $4.3 billion from $13.1 billion in the first quarter. Despite this slowdown, borrowing remained robust for non-mortgage loans (+$17.6 billion) and bonds (+$4.9 billion) in the second quarter. However, listed shares recorded the largest net redemption on record (-$22.0 billion), fuelled by notable merger and acquisition activity. This was also an unprecedented sixth consecutive quarter of net redemptions in listed shares.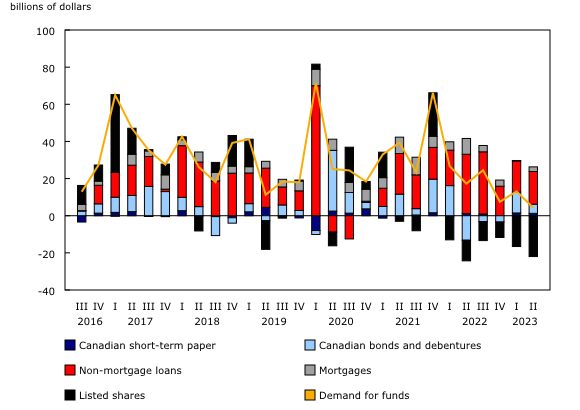
The demand for funds in Canada was $132.6 billion in the second quarter, up from $65.0 billion in the first quarter. A significant portion of these funds was provided by chartered banks, which injected almost $80 billion into financial and credit markets.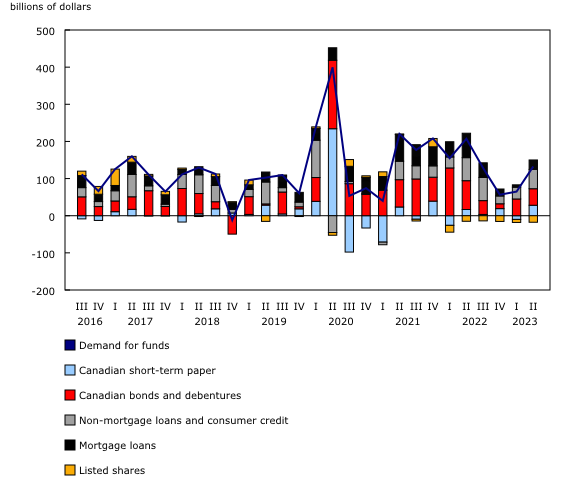
National net worth, the sum of national wealth and Canada's net foreign asset position, rose 1.8% to $17,364.8 billion at the end of the second quarter. This was the second consecutive increase after net worth shed more than one trillion dollars over the last three quarters of 2022. Despite the recent growth, national net worth remained 2.8% below its peak from the first quarter of 2022.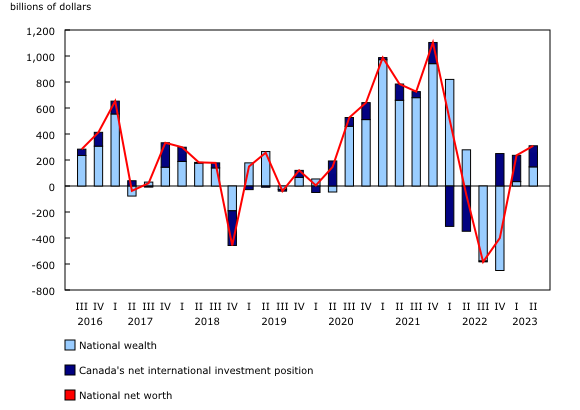
Revisions
This release of the national balance sheet and financial flow accounts for the second quarter of 2023 includes revised estimates for the first quarter of 2023. These data incorporate new and revised data, as well as updated data on seasonal trends.
Details on some of the more significant federal government COVID-19 support measures are now available in table 36-10-0687: Federal government COVID-19 response measures in the System of Macroeconomic Accounts, quarterly.
The data visualization product "Financial accounts on a from-whom-to-whom basis, selected financial instruments" has been updated with data from the first quarter to the second quarter of 2023.
Data on the national balance sheet and financial flow accounts for the third quarter of 2023 will be released on December 13, 2023.
This release of the financial and wealth accounts comprises the National Balance Sheet Accounts (NBSA), the Financial Flow Accounts (FFA), and the other changes in assets account.
The NBSA for the household sector is allocated across a number of socioeconomic dimensions as part of the distributions of household economic accounts. Data on wealth and its components by income quintile, age group, generation and region are available in tables 36-10-0585-01, 36-10-0586-01, 36-10-0589-01, and 36-10-0590-01.
The document, "An overview of revisions to the Financial and Wealth Accounts, 1990 to 2022," which is part of Latest Developments in the Canadian Economic Accounts (Catalogue number13-605-X), is now available.
For more information, or to enquire about the concepts, methods or data quality of this release, contact us (toll-free 1-800-263-1136; 514-283-8300; infostats@statcan.gc.ca) or Media Relations (statcan.mediahotline-ligneinfomedias.statcan@statcan.gc.ca).
* All content is copyrighted by Industry Intelligence, or the original respective author or source. You may not recirculate, redistrubte or publish the analysis and presentation included in the service without Industry Intelligence's prior written consent. Please review our terms of use.


