OTTAWA
,
March 11, 2022
(press release)
–
National net worth rises due to strong energy and house price growth The total value of non-financial assets in Canada, also referred to as national wealth, rose 5.2% in the fourth quarter to $15,576.0 billion. The value of residential real estate increased $455.9 billion to $8,683.1 billion, ending 2021 up $1.6 trillion from 2020 and over $2.5 trillion higher than 2019. Strong energy and mineral prices pushed the value of natural resources (excluding land) 16.0% higher than in the third quarter to $1,475.6 billion. This was the highest level since early 2008, when commodity prices were at record levels and crude oil surpassed $100 per barrel. Canada's net foreign asset position, the difference between Canada's international financial assets and international liabilities, continued its upward trend and reached $1,715.5 billion at the end of 2021, a quarterly increase of $297.0 billion. The fourth quarter closed another year of robust growth on the strength of global equity markets, to which Canada's international assets are highly exposed. Highlights While compensation of employees rose in the fourth quarter, overall household disposable income declined, mainly as a result of lower government transfers to households as pandemic-related benefits shrank. The household savings rate remained in single-digit territory, higher than pre-pandemic rates, but markedly lower than the double-digit savings rates recorded over much of the pandemic. Household demand for mortgages hit near-record levels as tighter monetary conditions loomed. The strong demand for mortgages came hand in hand with the unabated rise in house prices, while home inventory levels reached new lows. The household sector capped off a year of strong investment activity with record inflows to mutual funds. Both federal and other levels of government continued to borrow through the issuance of longer-term debt, albeit at a slower rate compared with the previous quarter. Private non-financial corporations doubled their demand for funds in the quarter, as merger and acquisition activity pushed listed share and bond issuances higher, while the financial sector slightly increased its supply of funds, primarily through lending in the form of mortgage and non-mortgage loans. Strong growth in both domestic and foreign financial markets led to robust growth in asset valuations following a weaker third quarter. Chart 1: Change in national net worth by component Household savings rate declines in the second half of 2021 With less disposable income and higher consumption expenditures, households were left with smaller net savings. The savings rate dropped to 6.4% in the fourth quarter from 9.0% in the third quarter. It fell into single-digit territory in the latter half of 2021 after five consecutive quarters in double-digit territory. Chart 2: Household savings rate, seasonally adjusted Households continue to purchase mutual funds at an unprecedented pace Net worth of households climbs once again The value of financial assets rose 3.4% in the fourth quarter on the strength of equity holdings, directly through holdings of listed and unlisted shares, as well as indirectly through mutual and pension funds, which invest significantly in equity instruments. The Toronto Stock Exchange rebounded, up 5.7% following a 0.5% drop in the third quarter, and the Standard and Poor's 500 jumped 10.6% after edging up in the third quarter. Home prices finish 2021 on a strong note, pushing the value of real estate higher Since the end of 2020, the value of residential real estate has grown 23.0%, accounting for 65.4% of the increase in household net worth over the same period. Prior to the onset of the global pandemic, annual growth in the value of residential real estate had reached 14.8% at its peak in 2006. Meanwhile, the value of real estate as a proportion of household disposable income continued to grow, rising to 562.2% in the fourth quarter from 538.3% in the third quarter. Strong mortgage borrowing in the quarter closes a record year as many Canadians continue to pursue home ownership The robust borrowing activity expanded the stock of credit market debt (consumer credit, and mortgage and non-mortgage loans) to $2,654.0 billion. Mortgage debt reached $1,952.9 billion, while non-mortgage loans stood at $701.1 billion. Overall, credit debt rose 1.9%, slower than the vigorous growth of the second quarter (+2.5%), but otherwise the fastest pace since the end of 2009. Chart 3: Household credit market debt, seasonally adjusted flows Ratio of household credit market debt to disposable income reaches new heights Given the significant growth in assets, households were less leveraged in the fourth quarter of 2021, as the debt to asset ratio fell to 14.48% from 14.82% one quarter prior. Over the last two years, this ratio has trended downward, falling from 16.37% at the end of 2019 as gains in real estate and financial instruments, frequently unrealized, have outstripped the growth in debt. The household debt service ratio, measured as total obligated payments of principal and interest on credit market debt as a proportion of household disposable income, increased to 13.84% in the fourth quarter of 2021 from 13.55% in the third quarter. However, it remained lower than the recent peak of 15.02% from the third quarter of 2019. Household disposable income before interest payments declined 1.2%, while total debt payments rose 0.9%. Interest payments on mortgage debt edged down 0.6%, while obligated payments of mortgage principal increased 2.8%, as lower rates realized through refinancing likely continued to put downward pressure on interest and increased borrowing pushed principal payments higher. In the first quarter of 2022, the Bank of Canada announced the first policy rate increase in three years. Chart 4: Household credit market debt to household disposable income, seasonally adjusted Federal government borrowing continues to rotate debt offerings towards longer time horizon For other levels of government (excluding social security funds), demand for credit market funds totalled $4.6 billion in the fourth quarter. This borrowing was largely made up of net issuances of paper (+$2.9 billion). In 2021, other levels of government issued a net total of $60.5 billion in bonds and $6.7 billion in short-term paper. On November 1, 2017, the Government of Canada discontinued the issuance of Canada Savings Bonds. In the fourth quarter of 2021, all remaining outstanding savings bonds reached maturity, with the liabilities related to this instrument falling to zero. However, amounts related to provincial savings bonds remain. Debt to gross domestic product declines as economic growth outpaces borrowing Chart 5: Net debt (book value) as a percentage of gross domestic product Private non-financial corporations' non-mortgage loan borrowing increases continuously Private non-financial corporations' mineral and energy reserves, which are the biggest component of private non-financial corporations' natural resource wealth and a contributor to their net worth, increased by 22.0% from the third quarter to reach $1,047.6 billion in the fourth quarter of 2021. By the end of the year, they increased by 175.7% compared with the end of 2020, as the price of crude oil and bitumen rose 57.1% and the price of coal jumped 104.3%, according to Statistics Canada's Raw Materials Price Index. Crude oil prices continued to climb in the first quarter of 2022. According to data from the Canadian Survey on Business Conditions released in February 2022, 76.6% of businesses reported having the cash or liquid assets required to operate over the next three months, a continued decrease from the 79.3% reported in August 2021. Meanwhile, the portion of businesses that reported they cannot incur additional debt increased from 19.4% in the third quarter, according to the survey data released in November 2021, to 25.4% in the fourth quarter. The ratio of private non-financial corporations' credit market debt (book value) to GDP stood at 71.9% in the fourth quarter. The ratio continued to decline, moderated by growing GDP, from the beginning of 2021, when it reached a record high of 75.4%. Overall, interest payments on debt, considered a component of property income paid, have also been trending lower, falling from $87.4 billion in 2019 to $81.4 billion in 2020 and then rising slightly to $82.4 billion in 2021. Rate cuts in early 2020 contributed to this decline as businesses were likely able to borrow on better terms. Chart 6: Demand for funds by private non-financial corporations Financial sector supply of funds increases The total financial assets of the Bank of Canada grew by $2.2 billion because of an increase in holdings of Government of Canada bonds (+$13.8 billion) as part of the Government of Canada Bond Purchase Program. This increase was partially offset by a decrease in reverse repurchase agreements (-$6.2 billion), as the Bank of Canada's Contingent Term Repo Facility continued to unwind; this program was discontinued effective April 2021. The market value of financial corporations' financial assets rose 3.4% to $20,419.7 billion by the end of the fourth quarter. The increase was due to a $503.3 billion rise in the value of equity and investment fund share assets. Reverse repurchase agreements of chartered banks increased by $49.3 billion to reach $439.4 billion. The financial assets of mutual funds, whose wealth is principally held by households, grew by $167.9 billion to reach $3,365.3 billion. This increase was mainly due to a rise in foreign equity (+$111.0 billion). Of the $519.3 billion of mutual fund holdings of listed shares, roughly half are of non-financial private corporations and around 20% are of chartered banks. Chart 7: Lending by the financial sector Note to readers Data enhancements to the national balance sheet and financial flow accounts, such as the development of detailed counterparty information by sector, will be incorporated on an ongoing basis. To facilitate this initiative and others, it is necessary to extend the annual revision period (normally the previous three years) at the time of the third-quarter release. Consequently, for the next two years, with the third-quarter release of the financial and wealth accounts, data will be revised back to 1990 to ensure a continuous time series. Financial and wealth accounts on a from-whom-to-whom basis: Selected financial instruments Next release Overview of the financial and wealth accounts The NBSA are composed of the balance sheets of all sectors and subsectors of the economy. The main sectors are households, non-profit institutions serving households, financial corporations, non-financial corporations, government and non-residents. The NBSA cover all national non-financial assets and all financial asset-liability claims outstanding in all sectors. To improve the interpretability of financial flows data, selected household borrowing series are available on a seasonally adjusted basis (table 38-10-0238-01). All other data are unadjusted for seasonal variation. For information on seasonal adjustment, see Seasonally adjusted data – Frequently asked questions. The FFA articulate net lending or borrowing activity by sector by measuring financial transactions in the economy. The FFA arrive at a measure of net financial investment, which is the difference between transactions in financial assets and liabilities (for example, net purchases of securities less net issuances of securities). The FFA also provide the link between financial and non-financial activity in the economy, which ties estimates of saving and non-financial capital acquisition (for example, investment in new housing) to the underlying financial transactions. While the FFA record changes in financial assets and liabilities between opening and closing balance sheets that are associated with transactions during the accounting period, the value of assets and liabilities held by an institution can also change for other reasons. These other types of changes, referred to as other economic flows, are recorded in the other changes in assets account. There are two main components to this account. One is the other changes in the volume of assets account. This account includes changes in non-financial and financial assets and liabilities relating to the economic appearance and disappearance of assets, the effects of external events such as wars or catastrophes on the value of assets, and changes in the classification and structure of assets. The other main component is the revaluation account, showing holding gains or losses accruing to the owners of non-financial and financial assets and liabilities during the accounting period as a result of changes in market price valuations. At present, only the aggregate other change in assets is available within the Canadian System of Macroeconomic Accounts; no details are available on the different components. Definitions concerning financial indicators can be found in "Financial indicators from the National Balance Sheet Accounts" and in the Canadian System of Macroeconomic Accounts glossary. Distributions of household economic accounts The methodology for DHEA wealth estimates can be found in the article "Distributions of Household Economic Accounts, estimates of asset, liability and net worth distributions, 2010 to 2019: Technical methodology and quality report." Products As a complement to this release, you can also consult the document "An overview of revisions to the Financial and Wealth Accounts, 1990 to 2021," which is part of Latest Developments in the Canadian Economic Accounts (Catalogue number13-605-X). As a complement to this release, you can also consult the data visualization product "Distributions of Household Economic Accounts, Wealth: Interactive tool," which is part of Statistics Canada – Data Visualization Products (Catalogue number71-607-X). As a complement to this release, you can also consult the data visualization product "Securities statistics," which is part of Statistics Canada – Data Visualization Products (Catalogue number71-607-X). The Economic accounts statistics portal, accessible from the Subjects module of our website, features an up-to-date portrait of national and provincial economies and their structure. The Latest Developments in the Canadian Economic Accounts (Catalogue number13-605-X) is available. The User Guide: Canadian System of Macroeconomic Accounts (Catalogue number13-606-G) is available. The Methodological Guide: Canadian System of Macroeconomic Accounts (Catalogue number13-607-X) is available. The Special Data Dissemination Standard Plus product "Other Financial Corporations Survey," also known as "Assets and liabilities of other financial corporations by sector, market value, quarterly" (table 36-10-0668-01), is now available. Contact information Industry Intelligence Editor's Note: This press release omits select charts and/or marketing language for editorial clarity. Click here to view the full report.
National net worth, the sum of national wealth and Canada's net foreign asset position, rose 6.6% in the fourth quarter to $17,291.6 billion. Four consecutive quarters of sizeable growth fuelled a record annual increase in national net worth, while national net worth per capita reached $449,450 at the end of the year, compared with $363,562 at the end of 2020.
The Canadian economy continued to expand in the fourth quarter amid the easing of restrictions and emergence of the Omicron variant of COVID-19. Real gross domestic product (GDP) growth was mainly driven by increases in business investment in engineering structures, by home ownership transfer costs and by an accumulation of inventories. However, gains were partially offset by an increase in imports, which overshadowed rising exports.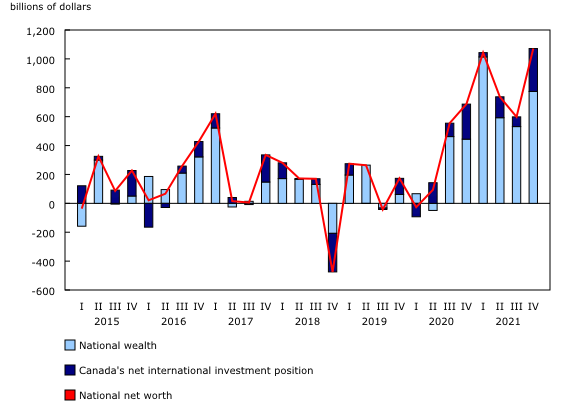
Continued easing of pandemic-related restrictions, despite the arrival of the Omicron variant late in the fourth quarter, helped boost nominal household consumption by 1.3% on a seasonally adjusted basis. Conversely, household disposable income was down 1.3% in the fourth quarter, the second consecutive quarterly decline, primarily because of an 11.9% decrease in government transfers to households, while compensation of employees grew 1.9%.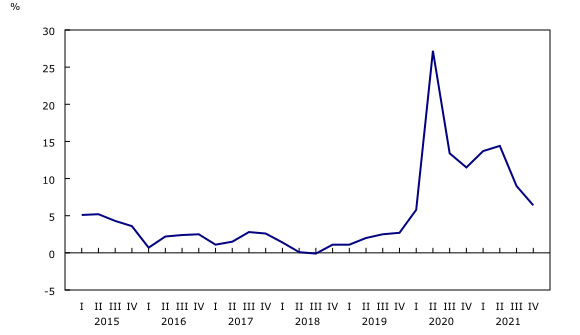
Households capped off a year of intense mutual fund investment activity with net purchases of $39.3 billion in the fourth quarter, breaking the previous record set only three quarters prior. Mutual fund purchases totalled $113.6 billion in 2021, well above the $53.1 billion recorded in 2020. Canadians may be looking for alternate investment opportunities with better returns. At the same time, households' currency and deposits grew $33.5 billion in the fourth quarter. Over the course of 2021, households added cash and deposits at about half the pace of 2020 as the household savings rate trended lower and consumption rebounded from 2020.
Household sector net worth—the value of all assets less liabilities—increased $706.3 billion to $15,903.5 billion in the fourth quarter. Growth in financial liabilities, which rose $49.4 billion fuelled by the continued expansion of outstanding mortgage debt, took a relatively small bite out of the much larger increase in the value of both financial and non-financial assets.
Household residential real estate rose 5.6% by the end of the fourth quarter, following a 3.2% increase in the third quarter. The value of residential land (+7.6%) and residential structures (+2.5%) posted sizeable gains. The average sale price increased 6.8% from the third quarter, as home resale inventory levels reached a record low. On a year-over-year basis, there were 7.4% fewer home sales recorded in the fourth quarter of 2021 compared with the same quarter one year prior. Nonetheless, real estate activity in the fourth quarter comfortably outpaced any fourth quarter prior to the onset of the pandemic.
On a seasonally adjusted basis, the pace of credit market borrowing accelerated slightly, with households adding $50.0 billion of debt in the fourth quarter. Mortgages remained the largest contributor to the heightened borrowing; demand, which reached $46.3 billion, still remained lower than the record $60.1 billion from the second quarter of 2021. Demand for non-mortgage loans declined to $3.7 billion in the fourth quarter from $5.6 billion in the third quarter. In 2021, households added a record $187.5 billion in mortgage debt, compared with $118.9 billion in 2020, which represented the previous annual record. By comparison, households accrued an additional $79.6 billion in mortgage debt in 2019. Variable rate mortgages have been the preferred product over the last 12 months, with their share of total residential mortgage debt of individuals rising from 18.5% at the end of 2020 to 28.1% at the end of 2021.
On a seasonally adjusted basis, household credit market debt as a proportion of household disposable income jumped to 186.2% in the fourth quarter, the highest level on record, compared with 180.4% in the third quarter (revised from 177.2%). Expanding household credit market debt (+1.9%), coupled with shrinking household disposable income (-1.3%), pushed the ratio higher. In other words, there was $1.86 in credit market debt for every dollar of household disposable income. By comparison, at the end of 2019, this ratio stood at 181.1%, while the previous record high was in the third quarter of 2018 (184.7%).
The federal government demand for credit market debt was $24.7 billion in the fourth quarter. This borrowing was composed of $30.4 billion in net issuances of federal government bonds, which were partially offset by net redemptions of short-term paper of $5.0 billion, indicating a continued strategy of longer-term borrowing. Non-residents accounted for the majority of federal bond net purchases (+$27.7 billion) in the quarter, the first such occurrence since the start of the pandemic as the Bank of Canada slowed its asset purchases. In 2021, the federal government issued a net total of $172.5 billion in bonds and redeemed a net total of $59.3 billion in short-term paper.
The ratio of federal government net debt (the book value of total financial liabilities less total financial assets) to gross domestic product (GDP) declined to 37.2% in the fourth quarter from 37.8% in the third quarter, while the ratio of other government net debt to GDP fell to 24.8% from 25.0% over the same period. Stronger growth in GDP relative to debt was a primary factor in the ratio decline.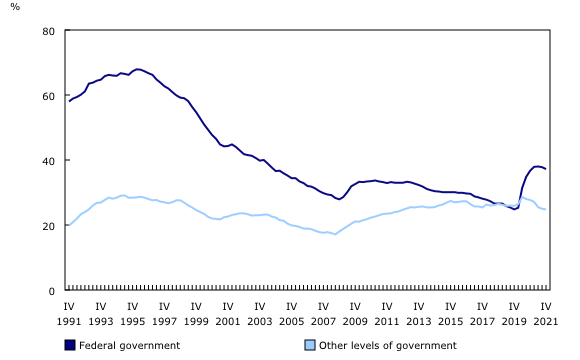
The demand for funds by private non-financial corporations spiked from $26.6 billion in the third quarter to $65.4 billion at the end of 2021, the second-highest pace since the beginning of the pandemic. Borrowing was mainly in the form of non-mortgage loans (+$22.7 billion), listed shares (+$18.5 billion), and bonds and debentures (+$17.8 billion), with the latter two items fuelled by significant merger and acquisition activity at the end of the year. The demand for funds was $144.1 billion in 2021, compared with $140.6 billion in 2020, with the increase mainly driven by greater demand for non-mortgage loans.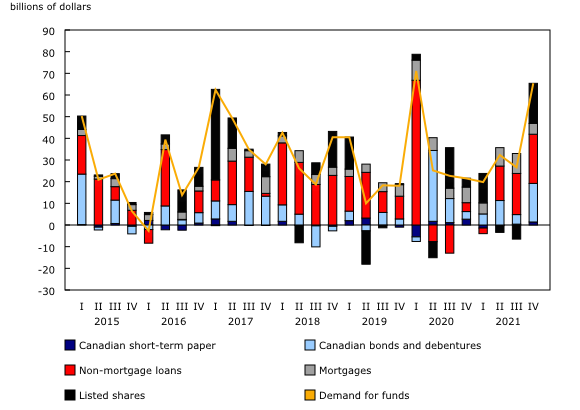
Financial corporations delivered $102.7 billion in funds to the economy through financial market instruments in the fourth quarter of 2021, an increase of $5.3 billion from the previous quarter. The supply of funds was primarily in the form of mortgage and non-mortgage loans, at $49.3 billion and $44.3 billion, respectively.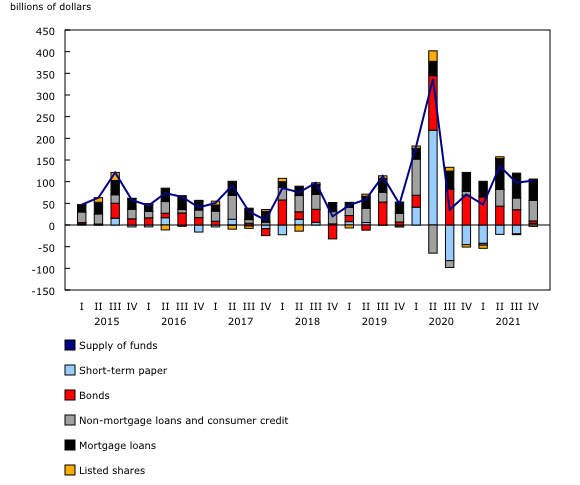
Revisions
This release of the national balance sheet and financial flow accounts for the fourth quarter of 2021 includes revised estimates from the first quarter to the third quarter of 2021. These data incorporate new and revised data, as well as updated data on seasonal trends. An overview of the conceptual, methodological and statistical revisions incorporated as of the release for the third quarter of 2021 is available in "An overview of revisions to the Financial and Wealth Accounts, 1990 to 2021."
The data visualization product "Financial accounts on a from-whom-to-whom basis, selected financial instruments" has been updated with data from the first quarter to the fourth quarter of 2021. Additionally, a new instrument, unlisted shares, has been added.
Data on the national balance sheet and financial flow accounts for the first quarter of 2022 will be released on June 10, 2022.
This release of the financial and wealth accounts comprises the National Balance Sheet Accounts (NBSA), the Financial Flow Accounts (FFA) and the other changes in assets account.
The NBSA for the household sector is allocated across a number of socioeconomic dimensions as part of the distributions of household economic accounts (DHEA). Data on wealth and its components by income quintile, age group, generation and region are available in tables 36-10-0585-01, 36-10-0586-01, 36-10-0589-01 and 36-10-0590-01.
The data visualization product "Financial accounts on a from-whom-to-whom basis, selected financial instruments," which is part of Statistics Canada – Data Visualization Products (Catalogue number71-607-X), is now available.
For more information, or to enquire about the concepts, methods or data quality of this release, contact us (toll-free 1-800-263-1136; 514-283-8300; infostats@statcan.gc.ca) or Media Relations (statcan.mediahotline-ligneinfomedias.statcan@statcan.gc.ca).
* All content is copyrighted by Industry Intelligence, or the original respective author or source. You may not recirculate, redistrubte or publish the analysis and presentation included in the service without Industry Intelligence's prior written consent. Please review our terms of use.


