OTTAWA
,
November 7, 2023
(press release)
–
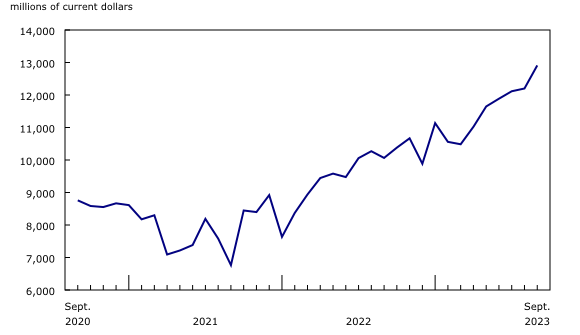
In September, Canada's merchandise exports increased 2.7%, while imports rose 1.0%. As a result, Canada's merchandise trade surplus widened from $949 million in August to $2.0 billion in September. Consult the International trade monthly interactive dashboard to explore the most recent results of Canada's international trade in an interactive format. Chart 1: Merchandise exports and imports Higher exports of crude oil and lower exports of gold Chart 2: Contribution to the monthly change in exports, by product, September 2023 Exports of energy products increased 10.6% in September to reach $16.9 billion. The export value of energy products represented more than one-quarter of Canada's total exports, the highest share since October 2022. In September 2023, almost all of the monthly gain was attributable to higher exports of crude oil (+13.7%), and this increase came largely on the strength of higher prices. The rise in crude oil prices coincided with the extension of voluntary production cuts by the Organization of the Petroleum Exporting Countries and its partners (OPEC+). Chart 3: Exports of crude oil and bitumen Exports of farm, fishing and intermediate food products increased 8.1% in September. Exports of wheat (+56.1%) increased the most, as favourable weather conditions allowed for a more rapid harvest in 2023. A similar gain in exports of wheat was observed in September 2022, when a good crop year and strong global demand for Canadian wheat began to have an impact on Canadian exports. This was followed by record high exports of wheat in October and November 2022. In 2023, however, Canadian wheat production is expected to decrease overall and global supplies have improved. Chart 4: Exports of wheat After reaching an all-time high in August, exports of metal and non-metallic mineral products fell 10.7% in September. Exports of unwrought gold, silver, and platinum group metals (-21.7%) contributed the most to the September decrease, with lower exports of gold to the United Kingdom and the United States. This decline was the result of lower gold asset transfers within the banking sector. Imports of passenger cars and light trucks continue to rise Chart 5: Contribution to the monthly change in imports, by product, September 2023 Imports of motor vehicles and parts rose 5.8% in September, a sixth consecutive monthly increase. These imports were up 24.0% in the first nine months of 2023 compared with the same period in 2022. Higher imports of passenger cars and light trucks (+9.4%) in September were responsible for most of the monthly increase, amid strong Canadian demand and increased model availability. Higher imports from Mexico led the gain in September. Despite disruptions caused by strike activity in the United States auto manufacturing industry, imports from that country were relatively stable, with inventories compensating for the loss of production. Chart 6: Imports of motor vehicles and parts Partially offsetting the overall increase, imports of industrial machinery, equipment and parts fell 3.6% in September. This followed an increase of 7.1% in August. Imports of other general-purpose machinery and equipment (-5.5%) posted the largest decline in September. Large shipments of heavy machinery for the steel and automotive manufacturing industries were recorded in August but did not repeat in September. The trade surplus with the United States widens for a third consecutive month Exports to countries other than the United States increased 2.9% in September, while imports from these countries edged down 0.2%. As a result, Canada's merchandise trade deficit with countries other than the United States narrowed from $10.1 billion in August to $9.6 billion in September. Energy products drive the quarterly exports increase After an increase of 0.3% in the second quarter, imports were down 0.8% in the third quarter. Widespread declines were partly offset by the rise in imports of motor vehicles and parts (+7.7%), which posted a sixth consecutive quarterly increase. In real terms, quarterly exports increase, while imports decrease Real imports were down 0.4% in the third quarter. As observed in nominal terms, widespread declines were partly offset by higher imports of motor vehicles and parts (+7.5%). Revisions to August merchandise export and import data Chart 7: International merchandise trade balance Monthly trade in services When international trade in goods and services are combined, exports increased 2.2% to $82.1 billion in September, while imports rose 0.8% to $81.6 billion. As a result, Canada's trade balance with the world went from a deficit of $633 million in August to a surplus of $462 million in September. Note to readers International trade data by commodity are available on a BOP and a customs basis. International trade data by country are available on a customs basis for all countries and on a BOP basis for Canada's 27 principal trading partners (PTPs). The list of PTPs is based on their annual share of total merchandise trade—imports and exports—with Canada in 2012. BOP data are derived from customs data by adjusting for factors such as valuation, coverage, timing and residency. These adjustments are made to conform to the concepts and definitions of the Canadian System of National Accounts. For a conceptual analysis of BOP-based data versus customs-based data, see Balance of Payments trade in goods at Statistics Canada: Expanding geographic detail to 27 principal trading partners. For more information on these and other macroeconomic concepts, see the Methodological Guide: Canadian System of Macroeconomic Accounts (Catalogue number13-607-X) and the User Guide: Canadian System of Macroeconomic Accounts (Catalogue number13-606-G). The data in this release are on a BOP basis and are seasonally adjusted. Unless otherwise stated, values are expressed in nominal terms, or current dollars. References to prices are based on aggregate Paasche (current-weighted) price indexes (2012=100). Movements within aggregate Paasche prices can be influenced by changes in the share of values traded for specific goods, with sudden shifts in trading patterns—as observed with the COVID-19 pandemic—sometimes resulting in large movements in Paasche price indexes. Volumes, or constant dollars, are calculated using the Laspeyres formula (2012=100), unless otherwise stated. For information on seasonal adjustment, see Seasonally adjusted data – Frequently asked questions. Revisions The previous year's customs-based data are revised with the release of data for the January and February reference months, and thereafter on a quarterly basis. The previous two years of customs-based data are revised annually, and revisions are released in February with the December reference month. The previous year's BOP-based data are revised with the release of data for the January, February, March and April reference months. To remain consistent with the Canadian System of Macroeconomic Accounts, revisions to BOP-based data for previous years are released annually in December with the October reference month. Factors influencing revisions include the late receipt of import and export documentation, incorrect information on customs forms, the replacement of estimates produced for the energy section with actual figures, changes in merchandise classification based on more current information, and changes to seasonal adjustment factors. The seasonal adjustment parameters are reviewed and updated annually and applied with the October reference month release. For information on data revisions for exports of energy products, see Methodology for Exports of Energy Products within the International Merchandise Trade Program. Revised data are available in the appropriate tables. Upcoming changes within the Canadian International Merchandise Trade program Nominal values based on NAPCS 2022 for the periods from January 1988 to October 2023 will be published on December 6, 2023. At the same time, price and volume statistics for the new reference year will be published for the periods from January 2017 to October 2023. These changes will be reflected in the third quarter statistics for the balance of international payments and gross domestic product, which are scheduled to be published in November 2023. For more information, please see NAPCS 2022 and Variant of NAPCS Canada 2022 Version 1.0 – Merchandise import and export accounts (forthcoming), or contact International Accounts and Trade Division Client Services at itdtrade@statcan.gc.ca. Note on the potential US government shutdown Real-time data table Next release Products The product "The International Trade Explorer" (Catalogue number71-607-X) is now available online. The online Canadian International Merchandise Trade Database is no longer available. It has been replaced by the Canadian International Merchandise Trade Web Application (Catalogue number71-607-X), a modern tool that provides trade data users with a number of enhancements. The updated Canada and the World Statistics Hub (Catalogue number13-609-X) is now available online. This product illustrates the nature and extent of Canada's economic and financial relationship with the world using interactive charts and tables. It provides easy access to information on trade, investment, employment and travel between Canada and a number of countries, including the United States, the United Kingdom, Mexico, China, Japan, Belgium, Italy, the Netherlands and Spain. Contact information Industry Intelligence Editor's Note: This press release omits select charts and/or marketing language for editorial clarity. Click here to view the full report. 
Total exports rose 2.7% in September, a third consecutive monthly increase. From June to September, the value of exports rose 11.4%. Increases were observed in 7 of the 11 product sections in September, with energy products accounting for most of the gain in total exports. The contribution of prices to the monthly export movement was noteworthy in September; exports were up slightly by 0.4% in real (or volume) terms.


Total imports increased 1.0% in September. Combined, the increases in Canadian exports observed in August and September have almost offset the decline in July, which was partly driven by port disruptions in British Columbia. Despite the overall increase in September, more product sections declined than increased in the month. In real (or volume) terms, imports were up 1.7%.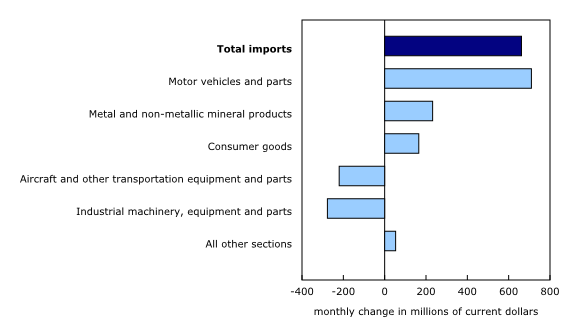
In September, exports to the United States were up 2.6%, largely because of higher exports of energy products. Meanwhile, imports from that country rose 1.7%. As a result, Canada's trade surplus with the United States widened for a third consecutive month, from $11.0 billion in August to $11.7 billion in September.
Following four consecutive quarterly declines, exports rose 4.3% in the third quarter of 2023. Exports of energy products (+18.5%) drove the quarterly increase, mainly because of higher prices. Excluding this product section, exports were up 0.6% in the third quarter.
In real terms (calculated using chained 2012 dollars), exports rose 0.6% in the third quarter of 2023. This followed a 0.4% decline in the second quarter. Real exports of energy products (+3.0%) contributed the most to the gain in the third quarter.
Imports in August, originally reported at $63.8 billion in the previous release, were revised to $64.3 billion in the current reference month. Exports in August, originally reported at $64.6 billion in the previous release, were revised to $65.3 billion in the current reference month's release.
In September, monthly service exports edged up 0.1% to $15.0 billion. Meanwhile, imports were essentially unchanged at $16.6 billion.
Merchandise trade is one component of Canada's international balance of payments (BOP), which also includes trade in services, investment income, current transfers, and capital and financial flows.
In general, merchandise trade data are revised on an ongoing basis for each month of the current year. Current-year revisions are reflected in the customs-based and the BOP-based data.
In the fall of 2023, Statistics Canada will be updating the North American Product Classification System (NAPCS) used for merchandise import and export statistics. The NAPCS 2022 version will replace NAPCS 2017, which is the version currently in use. Additionally, the reference year applicable to merchandise trade price and volume indexes will be updated from 2012 to 2017 (2017=100).
Under a 1990 agreement between Canada and the United States, each country uses the other's import data to produce statistics on its exports. If a US federal government shutdown was to occur, the United States Census Bureau would close, and Statistics Canada would not receive data on Canada's exports to the United States for the duration of the shutdown. As in the past, a prolonged shutdown could lead to a postponement of the publication of Canadian International Merchandise Trade statistics. Statistics Canada is closely monitoring this situation and will provide further information on potential impacts to its statistical programs as needed.
The real-time data table 12-10-0120-01 will be updated on November 20.
Data on Canadian international merchandise trade for October will be released on December 6.
The product "International trade monthly interactive dashboard" (Catalogue number71-607-X) is now available. This new interactive dashboard is a comprehensive analytical tool that presents monthly changes in Canada's international merchandise trade data on a balance-of-payments basis, fully supporting the information presented every month in the Daily release.
For more information, or to enquire about the concepts, methods or data quality of this release, contact us (toll-free 1-800-263-1136; 514-283-8300; infostats@statcan.gc.ca) or Media Relations (statcan.mediahotline-ligneinfomedias.statcan@statcan.gc.ca).
* All content is copyrighted by Industry Intelligence, or the original respective author or source. You may not recirculate, redistrubte or publish the analysis and presentation included in the service without Industry Intelligence's prior written consent. Please review our terms of use.


