OTTAWA
,
January 9, 2024
(press release)
–
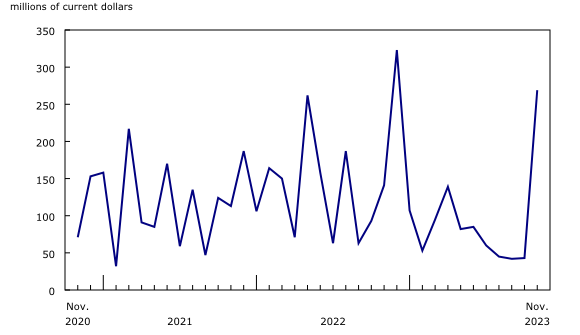
In November, Canada's merchandise imports increased 1.9%, while exports were down 0.6%. As a result, Canada's merchandise trade surplus with the world narrowed from $3.2 billion in October to $1.6 billion in November. This represents a fourth consecutive monthly trade surplus. Consult the "International trade monthly interactive dashboard" to explore the most recent results of Canada's international trade in an interactive format. Chart 1: Merchandise exports and imports Imports of energy products increase Chart 2: Contribution to the monthly change in imports, by product, November 2023 Imports of energy products increased 11.6% in November, following two consecutive monthly declines. Imports of nuclear fuel and other energy products increased the most, mainly on higher imports of uranium from Kazakhstan. No significant uranium imports were recorded from April to October. Despite the November increase, imports of nuclear fuel and other energy products were down 30.0% in the year so far, compared with the first 11 months of 2022. Also contributing to the growth in imports of energy products in November, imports of refined petroleum energy products rose 18.8%, on higher imports of motor gasoline and aviation fuel from the United States. These gains coincided with outages reported in Canadian refineries in the fall of 2023. Chart 3: Imports of nuclear fuel and other energy products Imports of industrial machinery, equipment and parts (+4.9%) also rose in November. Imports of other general-purpose machinery and equipment (+7.7%) reached a record high in November and contributed the most to the increase. This was driven in large part by higher imports of turbines and generator equipment destined for wind farm projects in Alberta. Higher imports of parts of industrial machinery and equipment (+6.5%) also contributed to the gain in November. After two consecutive monthly decreases, imports of electronic and electrical equipment and parts rose 4.7% in November. Imports in all subcategories increased, led by computers and computer peripherals (+9.9%), which have been volatile throughout 2023. Imports of electrical components rose 9.4% in November, mainly on higher imports of electric wire and cable from Sweden. Exports decrease for the first time since June Chart 4: Contribution to the monthly change in exports, by product, November 2023 Exports of metal and non-metallic mineral products decreased 6.5% in November, mainly on lower exports of unwrought gold, silver, and platinum group metals (-13.8%). Following record exports for this subcategory in August, significant declines were observed in September and again in November. These movements were mainly the result of variations in gold asset transfers within the banking sector. Despite the monthly decrease, export levels for unwrought gold, silver, and platinum group metals remained higher in November than before the surge in August. Chart 5: Exports of unwrought gold, silver, and platinum group metals, and their alloys Exports of aircraft and other transportation equipment and parts decreased 16.8% in November. Following a strong increase in October, exports of other transportation equipment fell back to more typical levels in November and contributed the most to the decline in the product section. Exports of aircraft were also down in November, mainly on lower exports of business jets to the United States. Exports to countries other than the United States decrease Exports to the United States were up 0.4% in November, while imports from that country rose 1.7%. As a result, Canada's trade surplus with the United States narrowed from $12.1 billion in October to $11.7 billion in November. Revisions to October merchandise export and import data Chart 6: International merchandise trade balance Monthly trade in services When international trade in goods and services are combined, exports decreased 0.3% to $82.4 billion in November, while imports increased 1.5% to $81.8 billion. As a result, Canada's trade surplus with the world went from $2.0 billion in October to $594 million in November. Note to readers Guide to Canadian International Merchandise Trade Statistics Recent changes within the Canadian International Merchandise Trade program Note on the potential US government shutdown Real-time data table Next release Products The product "The International Trade Explorer" (Catalogue number71-607-X) is now available online. The online Canadian International Merchandise Trade Database is no longer available. It has been replaced by the Canadian International Merchandise Trade Web Application (Catalogue number71-607-X), a modern tool that provides trade data users with a number of enhancements. The updated "Canada and the World Statistics Hub" (Catalogue number13-609-X) is now available online. This product illustrates the nature and extent of Canada's economic and financial relationship with the world using interactive charts and tables. It provides easy access to information on trade, investment, employment and travel between Canada and a number of countries, including the United States, the United Kingdom, Mexico, China, Japan, Belgium, Italy, the Netherlands and Spain. Contact information Industry Intelligence Editor's Note: This press release omits select charts and/or marketing language for editorial clarity. Click here to view the full report.
After decreasing 2.9% in October, total imports rose 1.9% in November, with increases in 8 of the 11 product sections. Year over year, imports were down 0.1%. In real (or volume) terms, November imports were up 1.6% from October.
Following four consecutive monthly gains, total exports declined 0.6% in November. This decrease occurred despite increases in 7 of the 11 product sections. Metal and non-metallic mineral products, as well as aircraft and other transportation equipment and parts posted the largest declines by far. Excluding these two product sections, exports increased 1.0% in November. In real (or volume) terms, total exports were down 0.1%.

Exports to countries other than the United States fell 4.2% in November, following an increase of 5.1% in October. The decline was largely driven by lower exports to Saudi Arabia (other transportation equipment) and Switzerland (unwrought gold). Imports from countries other than the United States rose 2.3% in November. Imports from Kazakhstan (nuclear fuels), the United Kingdom (unwrought gold) and China (various products) posted the largest gains. Canada's trade deficit with countries other than the United States widened from $9.0 billion in October to $10.1 billion in November.
Imports in October, originally reported at $63.0 billion in the previous release, were essentially unchanged in the current reference month. Exports in October, originally reported at $66.0 billion in the previous release, were revised to $66.2 billion in the current reference month's release.
In November, monthly service exports were up 1.0% to $16.6 billion. Meanwhile, imports edged down 0.1% to $17.6 billion.
Information on concepts and methods used for the monthly release of Canada's international merchandise trade is now available online. Please see Notes on the monthly release of Canadian international merchandise trade for more details.
The new "Guide to Canadian International Merchandise Trade Statistics" (Catalogue number13-605-X) will be published on January 22, 2024. This guide will provide essential definitions, describe key concepts and methodology, and outline data processes for Canadian International Merchandise Trade statistics. An overview of the published data, including descriptions of product, industry, and geographical classifications, will be provided along with links to the products where these data are available.
On December 6, 2023, Statistics Canada updated the North American Product Classification System (NAPCS) used for merchandise import and export statistics from NAPCS 2017 to NAPCS 2022. Additionally, the reference year applicable to merchandise trade price and volume indexes has been updated from 2012 to 2017 (2017=100). For more information, please see Variant of NAPCS Canada 2022 Version 1.0 – Merchandise import and export accounts, or contact International Accounts and Trade Division Client Services at (itdtrade@statcan.gc.ca).
Under a 1990 agreement between Canada and the United States, each country uses the other's import data to produce statistics on its exports. If a US government shutdown were to occur and affect the Department of Commerce, the United States Census Bureau would close, and Statistics Canada would not receive data on Canada's exports to the United States for the duration of the shutdown. As in the past, a prolonged shutdown could lead to a postponement of the publication of Canadian International Merchandise Trade statistics. Statistics Canada is closely monitoring this situation and will provide further information on potential impacts to its statistical programs as needed.
The real-time data table 12-10-0165-01 will be updated on January 22.
Data on Canadian international merchandise trade for December 2023 will be released on February 7, 2024.
The product "International trade monthly interactive dashboard" (Catalogue number71-607-X) is now available. This new interactive dashboard is a comprehensive analytical tool that presents monthly changes in Canada's international merchandise trade data on a balance-of-payments basis, fully supporting the information presented every month in the Daily release.
For more information, or to enquire about the concepts, methods or data quality of this release, contact us (toll-free 1-800-263-1136; 514-283-8300; infostats@statcan.gc.ca) or Media Relations (statcan.mediahotline-ligneinfomedias.statcan@statcan.gc.ca).
* All content is copyrighted by Industry Intelligence, or the original respective author or source. You may not recirculate, redistrubte or publish the analysis and presentation included in the service without Industry Intelligence's prior written consent. Please review our terms of use.


