OTTAWA
,
March 8, 2022
(press release)
–
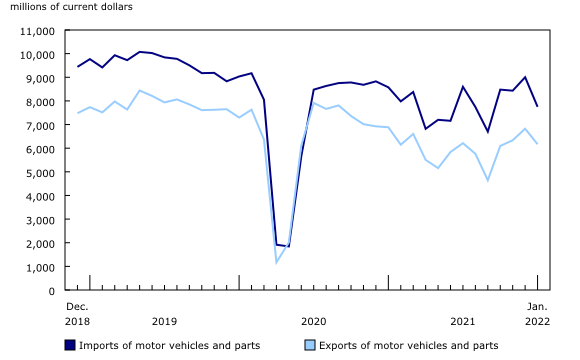
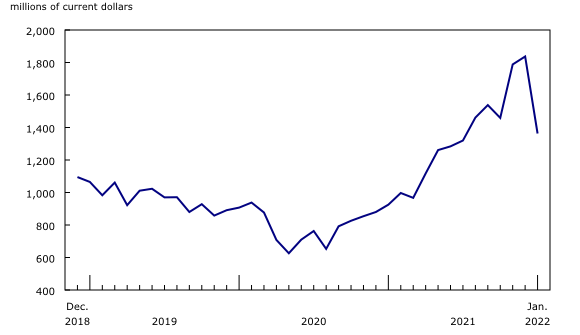
In January, Canada's merchandise imports fell 7.4%, with decreases observed in nearly all product sections. This follows three months of strong growth for total imports. Meanwhile, exports edged down 0.2%, mainly on lower exports of passenger cars and light trucks. As a result, after posting its first deficit in seven months in December 2021, Canada's merchandise trade balance swung back into a surplus position in January 2022. It went from a $1.6 billion deficit in December to a $2.6 billion surplus in January 2022. Consult the "International trade monthly interactive dashboard" to explore the most recent results of Canada's international trade in an interactive format. Chart 1: Merchandise exports and imports Passenger cars and light trucks tops widespread declines in total imports Chart 2: Contribution to the monthly change in imports, by product, January 2022 Imports of motor vehicles and parts decreased 13.9% in January, more than offsetting the 6.8% increase observed in December 2021. Imports of passenger cars and light trucks fell 12.4%, partly because of lower imports from the United States. While some outlets reported increased production in the United States in January 2022, manufacturers often prioritize satisfying the US market before exporting to Canada. Imports of engines and parts (-15.4%) also contributed substantially to the decrease. Canadian automobile production usually bounces back following the downtime for the holidays in December; however, it declined in January 2022 in part because of supply issues, which explains the drop in imports of engines and parts. Chart 3: Canadian imports and exports of motor vehicles and parts After reaching a record high in December, imports of electronic and electrical equipment and parts decreased 9.0% in January 2022. Like in December, imports of communication, and audio and video equipment (-27.6%), a category that is largely composed of smartphones, were the main contributor to the movement in January 2022. These imports have shown larger variations than usual in recent months, coinciding with disruptions in the global supply chain. This caused imports of cell phones to post an irregular seasonal pattern, especially at the end of 2021. Imports of metal and non-metallic mineral products decreased 11.8% in January 2022. This followed increases of 7.4% in November and 4.9% in December 2021. The two sub groupings that include iron and steel—basic and semi-finished iron and steel products (-22.1%), and unwrought iron, steel and ferro-alloys (-51.5%)—were both behind the decrease in January. Taken together, imports of these sub groupings more than doubled in 2021, mainly because of higher prices. In January 2022, these imports fell mainly on lower volumes. Chart 4: Canadian imports of iron and steel products Large declines were also observed in other product sections in January. Imports of consumer goods were down 4.5%, in part on decreased imports of clothing, footwear and accessories (-14.0%), as well as miscellaneous goods and supplies (-6.8%). Imports of basic and industrial chemical, plastic and rubber products fell 8.5%, mainly on lower imports of lubricants and other petroleum refinery products (-16.6%), and fertilizers, pesticides and other chemical products (-13.2%). Finally, imports of energy products were down 12.2%, largely on lower imports of crude oil (-22.0%). Higher prices sustain export values Chart 5: Contribution to the monthly change in exports, by product, January 2022 Following three months of gains, exports of motor vehicles and parts fell 9.6% in January. While exports typically bounce back in January after downtime during the December holidays, this rebound did not occur in 2022, resulting in a sharp seasonally adjusted decline in exports of passenger cars and light trucks (-15.0%). Supply chain issues continued to affect the Canadian auto industry in January, forcing most auto manufacturers to reduce production. Exports of aircraft and other transportation equipment and parts decreased 25.8% in January. Aircraft exports declined the most, down 57.3% to $284 million, the lowest level since January 2018. Fewer private jets and commercial aircraft were exported in January 2022. These declines were almost entirely offset by higher exports of energy products, which increased 8.7% in January, following an 11.8% decline in December 2021. Higher exports of natural gas (+66.4%) contributed the most to the gain, in large part because of increased prices. Exports of coal also rose, up 50.7% in January 2022 after sharp declines in both November and December 2021, which coincided with weather-related disruptions to transportation lines on the Canadian west coast. Widening trade surplus with the United States Chart 6: International merchandise trade balance When the average exchange rates of December 2021 and January 2022 are compared, the Canadian dollar gained 1.1 US cents relative to the American dollar. Exports to countries other than the United States were down 4.6% in January. Exports destined to France (aircraft) and the United Kingdom (various products) contributed the most to the decrease. Imports from countries other than the United States declined 11.8%. Lower imports from China (cell phones and computers) and Germany (passenger cars and light trucks) were observed. Canada's trade deficit with countries other than the United States narrowed from $8.6 billion in December 2021 to $6.7 billion in January 2022. Trade information related to recent events Blockades at border crossings Canada's trade relationship with Russia and Ukraine In terms of Canadian trade with Ukraine, both exports and imports posted values around the $220 million mark in 2021. Revisions to December merchandise export and import data Monthly trade in services When international trade in goods and international trade in services were combined, exports decreased 0.8% to $68.2 billion in January, while imports were down 6.6% to $65.9 billion. As a result, Canada went from a trade deficit with the world of $1.8 billion in December 2021 to a surplus of $2.3 billion in January 2022. Note to readers International trade data by commodity are available on both a BOP and a customs basis. International trade data by country are available on a customs basis for all countries and on a BOP basis for Canada's 27 principal trading partners (PTPs). The list of PTPs is based on their annual share of total merchandise trade—imports and exports—with Canada in 2012. BOP data are derived from customs data by adjusting for factors such as valuation, coverage, timing and residency. These adjustments are made to conform to the concepts and definitions of the Canadian System of National Accounts. For a conceptual analysis of BOP-based data versus customs-based data, see "Balance of Payments trade in goods at Statistics Canada: Expanding geographic detail to 27 principal trading partners." For more information on these and other macroeconomic concepts, see the Methodological Guide: Canadian System of Macroeconomic Accounts (Catalogue number13-607-X) and the User Guide: Canadian System of Macroeconomic Accounts (Catalogue number13-606-G). The data in this release are on a BOP basis and are seasonally adjusted. Unless otherwise stated, values are expressed in nominal terms, or current dollars. References to prices are based on aggregate Paasche (current-weighted) price indexes (2012=100). Movements within aggregate Paasche prices can be influenced by changes in the share of values traded for specific goods, with sudden shifts in trading patterns—as observed currently with the COVID-19 pandemic—sometimes resulting in large movements in Paasche price indexes. Volumes, or constant dollars, are calculated using the Laspeyres formula (2012=100), unless otherwise stated. For information on seasonal adjustment, see Seasonally adjusted data – Frequently asked questions. Revisions The previous year's customs-based data are revised with the release of data for the January and February reference months, and thereafter on a quarterly basis. The previous two years of customs-based data are revised annually, and revisions are released in February with the December reference month. The previous year's BOP-based data are revised with the release of data for the January, February, March and April reference months. To remain consistent with the Canadian System of Macroeconomic Accounts, revisions to BOP-based data for previous years are released annually in December with the October reference month. Factors influencing revisions include the late receipt of import and export documentation, incorrect information on customs forms, the replacement of estimates produced for the energy section with actual figures, changes in merchandise classification based on more current information, and changes to seasonal adjustment factors. The seasonal adjustment parameters are reviewed and updated annually, and applied with the October reference month release. For information on data revisions for exports of energy products, see Methodology for Exports of Energy Products within the International Merchandise Trade Program. Revised data are available in the appropriate tables. Real-time data table Next release Products The product "The International Trade Explorer" (Catalogue number71-607-X) is now available online. The Canadian International Merchandise Trade online database is no longer available. It has been replaced by the Canadian International Merchandise Trade Web Application (Catalogue number71-607-X), a modern tool that provides trade data users with a number of enhancements. The updated "Canada and the World Statistics Hub" (Catalogue number13-609-X) is now available online. This product illustrates the nature and extent of Canada's economic and financial relationship with the world using interactive charts and tables. It provides easy access to information on trade, investment, employment and travel between Canada and a number of countries, including the United States, the United Kingdom, Mexico, China, Japan, Belgium, Italy, the Netherlands and Spain. Contact information Industry Intelligence Editor's Note: This press release omits select charts and/or marketing language for editorial clarity. Click here to view the full report. 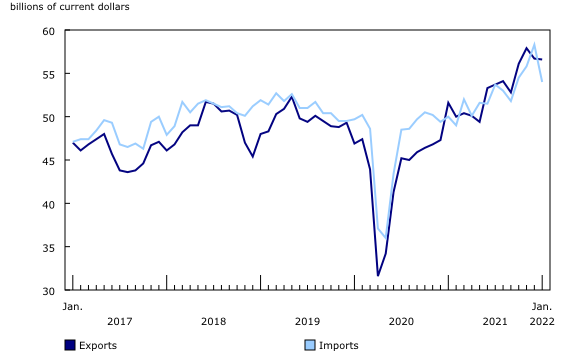
Total imports fell sharply in January, down 7.4% to $54.0 billion. Declines were observed in 10 of the 11 product sections, with 9 decreasing by more than $100 million. Despite the decreases, total imports were up 8.0% on a year-over-year basis. In real (or volume) terms, total imports fell 8.5% in January.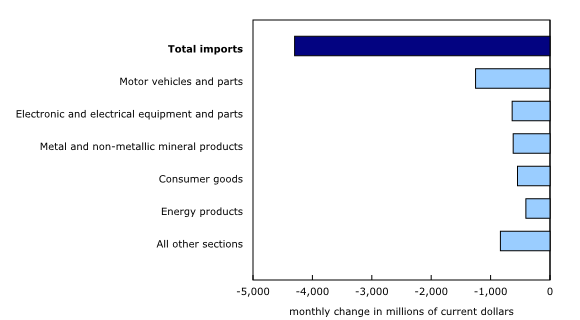
Total exports edged down 0.2% in January to $56.6 billion, with declines observed in 7 of 11 product sections. A 4.6% drop in real (or volume) terms was almost entirely offset by an increase in export prices. Excluding energy products, exports were down 2.7%.
Exports to the United States rose 1.2% in January, while imports from that country were down 4.7%. As a result, Canada's trade surplus with the United States widened from $7.1 billion in December 2021 to $9.3 billion in January 2022, the largest trade surplus since July 2008.
International trade data can help provide contextual information on recent events in Canada and abroad.
At the end of January and in February 2022, some border crossings between Canada and the United States were blocked by protesters, preventing the normal flow of goods between the two countries at these passages. The Ambassador Bridge in Windsor (Ontario) is the most important crossing point for Canada's merchandise trade. Statistics Canada data show that in 2021 the Ambassador Bridge was associated with almost 24% of Canada's merchandise trade activity by road. Taken together, the Coutts (Alberta), Emerson (Manitoba) and Pacific Highway (British Columbia) crossings account for another 12% of Canada's trade activity by road. Although imports and exports via these border points will likely be affected in the February reference month, the impact at the aggregate level could be mitigated by the use of alternate crossing points, or other modes of transportation.
Canada has responded to the situation in Ukraine by imposing further restrictions on trade with Russia. Some sanctions have already been in place since 2014, when Russia annexed Crimea. As per The International Trade Explorer, in 2021, exports to the Russian Federation on a customs basis amounted to $657 million, representing 0.1% of Canada's total merchandise exports to the world. Imports from Russia totalled $2.1 billion in 2021, making up 0.3% of all Canadian imports.
Imports in December, originally reported at $57.7 billion in the previous release, were revised to $58.3 billion in the release for the current reference month. Exports in December, originally reported at $57.6 billion in the previous release, were revised to $56.7 billion, mainly because estimates for crude oil and natural gas exports were replaced with actual data. These estimates can be subject to larger revisions during times of high volatility in energy prices.
In January, monthly service exports fell 4.0% to $11.6 billion. Service imports decreased 2.8% to $11.9 billion.
Merchandise trade is one component of Canada's international balance of payments (BOP), which also includes trade in services, investment income, current transfers, and capital and financial flows.
In general, merchandise trade data are revised on an ongoing basis for each month of the current year. Current-year revisions are reflected in both the customs-based and the BOP-based data.
The real-time data table 12-10-0120-01 will be updated on March 21.
Data on Canadian international merchandise trade for February will be released on April 5.
The product "International trade monthly interactive dashboard" (Catalogue number71-607-X) is now available. This new interactive dashboard is a comprehensive analytical tool that presents monthly changes in Canada's international merchandise trade data on a balance-of-payments basis, fully supporting the information presented every month in the Daily release.
For more information, or to enquire about the concepts, methods or data quality of this release, contact us (toll-free 1-800-263-1136; 514-283-8300; infostats@statcan.gc.ca) or Media Relations (statcan.mediahotline-ligneinfomedias.statcan@statcan.gc.ca).
* All content is copyrighted by Industry Intelligence, or the original respective author or source. You may not recirculate, redistrubte or publish the analysis and presentation included in the service without Industry Intelligence's prior written consent. Please review our terms of use.


