OTTAWA
,
January 15, 2024
(press release)
–
Canadian manufacturing sales increased 1.2% to $71.7 billion in November, mainly on higher sales in the chemical (+6.6%), primary metal (+4.0%) and machinery (+4.3%) subsectors. Sales in the motor vehicle industry group (-4.0%) declined the most. On a year-over-year basis, total sales were down 0.8% in November. Sales in constant dollars rose 1.6% in November, indicating that increased sales were driven by higher volumes as the Industrial Product Price Index fell 0.4% in November. Chart 1: Manufacturing sales Sales of chemical products lead monthly increase Following three consecutive monthly declines, sales of primary metal products rose 4.0% to $5.6 billion in November, mainly on higher volumes (+3.9%). The gains were primarily attributable to higher sales of non-ferrous metals (except aluminum) (+13.8%). Prices for non-ferrous metal (except aluminum) production and processing increased 1.2% in November. Sales of motor vehicles fell 4.0% to $5.2 billion in November, the second consecutive monthly decline. The continuation of a shutdown at a major auto assembly plant in Ontario for retooling contributed the most to the decrease. Despite the monthly decline, sales of motor vehicles were 26.8% higher on a year-over-year basis in November. Exports of motor vehicles and parts rose 1.4% in November. Sales increase in seven provinces, led by Ontario and Quebec In Ontario, sales increased 1.6% to $31.9 billion in November, following three consecutive monthly declines. Higher sales of basic chemicals (+37.8%) and pharmaceutical and medicine products (+26.6%) were responsible for the increase. Sales of motor vehicles posted the largest decrease, down 5.0% to $4.8 billion in November. On a year-over-year basis, total sales in Ontario were up 1.9% in November. In Quebec, sales increased 1.2% to $17.9 billion in November, mainly on higher sales in the primary metal subsector (+5.4%) as production ramped up in many non-ferrous metal plants. The increase was partly offset by lower sales of petroleum and coal products. Leading the provincial decline was New Brunswick, where sales fell 5.4% to $1.8 billion in November, the second consecutive monthly decrease. The decline was concentrated in the nondurable goods subsector (-7.6%). Total sales were down 16.6% year over year in November. Total inventories continue to increase Chart 2: Inventory levels increase The inventory-to-sales ratio declined from 1.74 in October to 1.73 in November. This ratio measures the time, in months, that would be required to exhaust inventories if sales were to remain at their current level. Chart 3: The inventory-to-sales ratio decreases Unfilled orders decrease Chart 4: Unfilled orders decrease Capacity utilization rate increases Chart 5: The capacity utilization rate increases Note to readers Seasonally adjusted data are data that have been modified to eliminate the effect of seasonal and calendar influences to allow for more meaningful comparisons of economic conditions from period to period. For more information on seasonal adjustment, see Seasonally adjusted data – Frequently asked questions. Trend-cycle estimates are included in selected charts as a complement to the seasonally adjusted series. These data represent a smoothed version of the seasonally adjusted time series and provide information on longer-term movements, including changes in direction underlying the series. For information on trend-cycle data, see Trend-cycle estimates – Frequently asked questions. Both seasonally adjusted data and trend-cycle estimates are subject to revision as additional observations become available. These revisions could be large and could even lead to a reversal of movement, especially for reference months near the end of the series or during periods of economic disruption. Non-durable goods industries include food; beverage and tobacco products; textile mills; textile product mills; apparel; leather and allied products; paper; printing and related support activities; petroleum and coal products; chemicals; and plastics and rubber products. Durable goods industries include wood products; non-metallic mineral products; primary metals; fabricated metal products; machinery; computer and electronic products; electrical equipment, appliances and components; transportation equipment; furniture and related products; and miscellaneous manufacturing. Production-based industries For the aerospace and shipbuilding industry groups, the value of production is used instead of the value of sales of goods manufactured. The value of production is calculated by adjusting monthly sales of goods manufactured by the monthly change in inventories of goods in process and finished products manufactured. The value of production is used because of the extended period of time that it normally takes to manufacture products in these industries. Unfilled orders are a stock of orders that will contribute to future sales, assuming that the orders are not cancelled. New orders are those received, whether sold in the current month or not. New orders are measured as the sum of sales for the current month plus the change in unfilled orders from the previous month to the current month. Manufacturers reporting sales, inventories and unfilled orders in US dollars Some Canadian manufacturers report sales, inventories and unfilled orders in US dollars. These data are then converted to Canadian dollars as part of the data production cycle. For sales, based on the assumption that they occur throughout the month, the average monthly exchange rate for the reference month established by the Bank of Canada is used for the conversion. The monthly average exchange rate is available in table 33-10-0163-01. Inventories and unfilled orders are reported at the end of the reference period. For most respondents, the daily average exchange rate on the last working day of the month is used for the conversion of these variables. However, some manufacturers choose to report their data as of a day other than the last working day of the month. In these instances, the daily average exchange rate on the day selected by the respondent is used. Note that because of exchange rate fluctuations, the daily average exchange rate on the day selected by the respondent can differ from both the exchange rate on the last working day of the month and the monthly average exchange rate. Daily average exchange rate data are available in table 33-10-0036-01. Revision policy Each month, the Monthly Survey of Manufacturing releases preliminary data for the reference month and revised data for the previous three months. Revisions are made to reflect new information provided by respondents and updates to administrative data. Once a year, a revision project is undertaken to revise multiple years of data. Real-time data tables Real-time data tables 16-10-0118-01, 16-10-0119-01, 16-10-0014-01 and 16-10-0015-01 will be updated on January 23. Next release Data from the Monthly Survey of Manufacturing for December 2023 will be released on February 15, 2024. Contact information Industry Intelligence Editor's Note: This press release omits select charts and/or marketing language for editorial clarity. Click here to view the full report.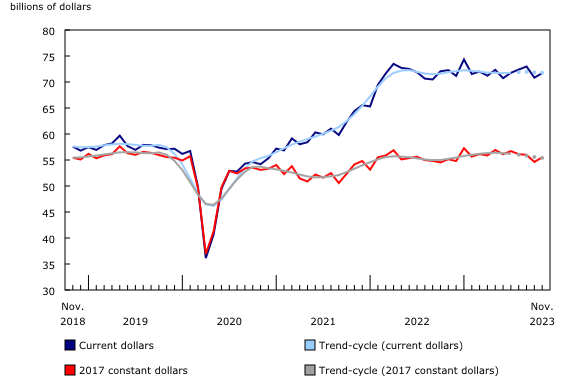
Following three consecutive monthly declines, sales of chemical products rose 6.6% to $5.6 billion in November, on higher volume of sales (+10.1%). Several petrochemical plants returned to normal production after shutdowns that began in September. The increase in sales of chemical products was more pronounced in the basic chemical (+11.3%) and pharmaceutical and medicine (+9.7%) industry groups. Despite the monthly gain, year-over-year sales of chemical products were down 1.1% in November.
Manufacturing sales increased in seven provinces in November, led by Ontario and Quebec, while New Brunswick recorded the largest decline.
Total inventories rose 0.5% to $124.2 billion in November, the highest level on record, driven by higher goods in process (+1.1%) and finished product (+0.6%) inventories. Higher inventories of transportation equipment (+2.3%), machinery (+2.0%) and petroleum and coal (+2.1%) led the increase.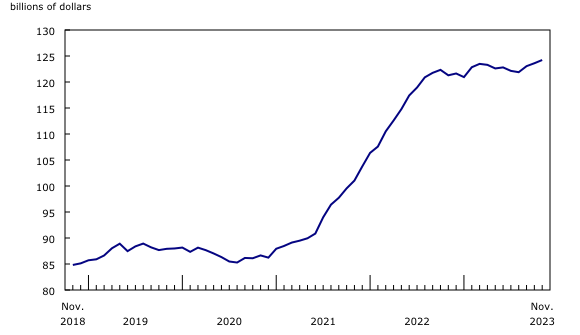

The total value of unfilled orders declined 0.8% to $101.5 billion in November, primarily due to a 2.5% decline in unfilled orders of aerospace products and parts. As 2023 neared its end, many aerospace manufacturers were filling their backlog orders, resulting in lower total unfilled orders.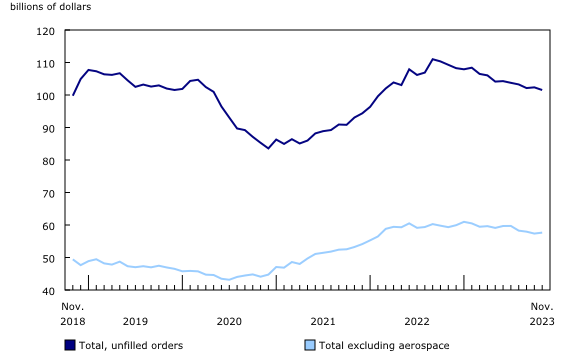
The capacity utilization rate (not seasonally adjusted) for the total manufacturing sector increased from 77.6% in October to 79.5% in November, on higher production. Capacity utilization rates were up in the transportation equipment (+4.3 percentage points), chemical (+4.5 percentage points), and petroleum and coal (+2.8 percentage points) subsectors. These increases were partly offset by lower capacity utilization rates in the beverage and tobacco (-3.3 percentage points) and wood (-1.5 percentage points) subsectors.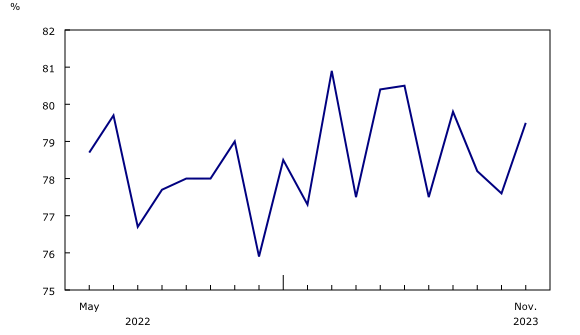
Monthly data in this release are seasonally adjusted and are expressed in current dollars, unless otherwise specified.
For more information, or to enquire about the concepts, methods or data quality of this release, contact us (toll-free 1-800-263-1136; 514-283-8300; infostats@statcan.gc.ca) or Media Relations (statcan.mediahotline-ligneinfomedias.statcan@statcan.gc.ca).
* All content is copyrighted by Industry Intelligence, or the original respective author or source. You may not recirculate, redistrubte or publish the analysis and presentation included in the service without Industry Intelligence's prior written consent. Please review our terms of use.


