OTTAWA
,
February 16, 2022
(press release)
–
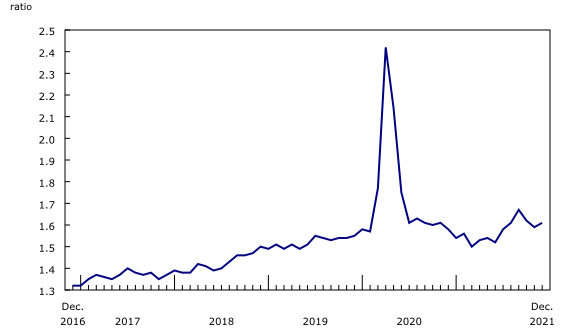
Manufacturing sales rose for a third consecutive month in December, rising 0.7% to $64.0 billion on higher sales in 11 of 21 industries, led by the plastic and rubber, motor vehicle, fabricated metal, as well as wood product industries. Chart 1: Manufacturing sales Sales in constant dollars increased 0.6% in December, indicating a higher volume of goods sold. The Industrial Product Price Index increased 0.7% month over month in December. Flooding in British Columbia impacts manufacturing Plastics and rubber and motor vehicle industries post the largest increase For the third consecutive month, motor vehicle and motor vehicle and part manufacturers in Canada were able to ramp up production as sales increased 8.2% in the motor vehicle and 1.6% in the motor vehicle part industries. Moreover, sales of motor vehicles recovered 21.0% overall in the fourth quarter, following a 10.1% increase in the third quarter. Production in the aerospace product and parts industry fell 10.7% in December, following a 9.7% increase in November. Ontario posts the largest sales increase In Ontario, sales increased 1.1% to $27.9 billion in December, led by the motor vehicle (+9.1%), plastic and rubber (+14.0%), and fabricated metal (+8.7%) industries. Sales in Alberta increased 1.8% to $7.7 billion in December, mainly on higher sales of petroleum (+11.1%). Total sales in Alberta rose 5.2% in the fourth quarter. Sales in Quebec decreased 1.2% to $16.4 billion in December, mostly due to lower production of aerospace product and parts (-14.3%). Toronto reports the largest sales increase In Toronto, sales rose for the third consecutive month, increasing 4.2% to $10.8 billion in December, driven by a higher sales of motor vehicles (+30.6%). Meanwhile, in Montréal, sales fell 2.1% to $7.3 billion in December, mostly on lower production of aerospace product and parts (-26.6%). Record-high inventory levels continue Chart 2: Inventory levels rise The inventory-to-sales ratio increased from 1.59 in November to 1.61 in December. The ratio measures the time, in months, that would be required to exhaust inventories if sales were to remain at their current level. Chart 3: The inventory-to-sales ratio increases Unfilled orders rise Chart 4: Unfilled orders rise Total value of new orders increased 1.4% to $65.6 billion in December, mainly attributable to higher new orders of transportation equipment industry (+7.9%). Capacity utilization rate decreases on lower production Chart 5: The capacity utilization rate decreases The capacity utilization rate fell in 13 of 21 industries in December, led by food (-2.5 percentage points) and primary metal (-4.6 percentage points). The decline was partially offset by an increase in the transportation equipment (+2.5 percentage points) and chemical (+4.0 percentage points) industries. Manufacturing: Year in review, 2021 Total manufacturing sales in current dollars increased 17.5% to $718.4 billion in 2021, on higher sales attributed to the petroleum and coal (+58.9%), primary metal (+40.7%), wood (+48.4%), food (+14.6%) and chemical (+19.9%) product industries. These five industries were responsible for over four-fifths of the total increase in current dollar sales in 2021. Overall, sales increased in 20 of 21 industries, with transportation equipment being the only industry to post a decline (-10.4%). Manufacturing sales in constant dollars were up 4.2% to $597.0 billion in 2021, with 15 of 21 industries posting higher sales following a 10.3% decline in 2020. The petroleum and coal, food, and machinery product industries contributed the most to the gains. Volume sales of petroleum products rose 12.0% to $77.5 billion in 2021 on higher global demand. In the food industry, sales in constant dollars increased 5.8% to $103.4 billion. Volume sales in the transportation industry fell the most, declining 9.4% to 77.6 billion in 2021, on lower sales of motor vehicle (-18.8%) and aerospace product and parts (-8.9%). Motor vehicle and part production has been impacted by the global semiconductor chip shortage, while travel restrictions led to production slowdowns in the aerospace product and parts industry. Regionally, manufacturing sales in current dollars increased in every province in 2021. Sales increased in Ontario (+11.3%) and Quebec (+19.5%) largely due to higher sales in the primary metal and petroleum and coal industries, and the increases were partially offset by lower sales in the transportation equipment industry, while higher sales of petroleum and coal and food led the increase in Alberta (+30.8%). Manufacturing sales were up in all 12 selected CMAs led by Montréal (+14.0%), Edmonton (+26.9%) and Toronto (+4.8%). Year-end inventory levels in 2021 grew 18.9% to $102.8 billion compared with 2020, mostly on higher inventories of primary metal (+28.8%), petroleum and coal (+42.9%), and machinery (+24.5%) industries. Supply chain disruptions led to higher prices of raw materials in many industries and resulted in this increased value of inventory stocks in 2021. The share in total inventories of both raw materials and finished products have been increasing since the onset of the COVID-19 pandemic, while the share of goods in process has declined. Recovery in manufacturing sector led by petroleum and coal product, primary metals and wood The primary metal industry continued its growth since the onset of the pandemic, reaching its highest level on record in November of 2021, at $5.8 billion. Current dollar sales were up 40.7% in 2021, mainly on higher prices, as constant dollar sales increased 2.3%. More specifically, the prices of iron, steel and aluminum have been affected by rising demand, higher prices of natural gas and lower production in China. Average prices for primary ferrous metal products were up 43.4% in 2021, while average prices of primary non-ferrous metal products were up 21.6%. Wood product sales, which began to increase steadily since the onset of the pandemic, continued to advance in 2021 and reached its highest level on record in May 2021, at $5.4 billion. Year-over-year wood product sales were up 48.4% in current dollars and 11.5% in constant dollars. The average prices for softwood lumber were 60.8% higher in 2021 compared with 2020, on increased construction activities in Canada and the United States and increased demand for forestry products and building and packaging materials. The total value of building permits increased 24.3% in 2021, while exports of lumber and other sawmill products rose 64.1%. Food sales increased 14.6% to $125.0 billion in 2021, the 14th consecutive yearly gain, driven by higher sales of grain and oilseed, meat and animal food products. Sales in constant dollars were up 5.8% in 2021. Prices of many food products rose in 2021 due to higher cost of materials, disruption in supply chains, and higher demand. In addition, drought in some western provinces impacted crop production, driving up prices for livestock feeds and, in turn, the price of meat products. Declines in the total harvest of canola seeds in 2021 impacted oil seed manufacturing, and sales in this industry rose 48.9% mainly on higher prices. In the eastern half of Canada, favourable growing conditions boosted production of crops. Sales of meat product manufacturing were up in Ontario (+16.6%) and Quebec (+14.5%) accordingly. After two consecutive yearly declines, sales of chemicals increased 19.9% to $61.4 billion in 2021, coinciding with increased prices of plastic resins and petrochemicals. Sales of resin, synthetic rubber, and artificial and synthetic fibres and filaments manufacturing industry was up 43.0%. The basic chemicals rose 25.3% in 2021 on higher demand and prices. Sales in the pesticide, fertilizer and other agricultural chemical industry was up 39.5% year over year, reflecting both increased food demand and higher cost of natural gas used in production. Transportation equipment industry shrinks Note to readers Seasonally adjusted data are data that have been modified to eliminate the effect of seasonal and calendar influences to allow for more meaningful comparisons of economic conditions from period to period. For more information on seasonal adjustment, see Seasonally adjusted data – Frequently asked questions. Trend-cycle estimates are included in selected charts as a complement to the seasonally adjusted series. These data represent a smoothed version of the seasonally adjusted time series and provide information on longer-term movements, including changes in direction underlying the series. For information on trend-cycle data, see Trend-cycle estimates – Frequently asked questions. Both seasonally adjusted data and trend-cycle estimates are subject to revision as additional observations become available. These revisions could be large and could even lead to a reversal of movement, especially for reference months near the end of the series or during periods of economic disruption. Non-durable goods industries include food; beverage and tobacco products; textile mills; textile product mills; clothing; leather and allied products; paper; printing and related support activities; petroleum and coal products; chemicals; and plastics and rubber products. Durable goods industries include wood products; non-metallic mineral products; primary metals; fabricated metal products; machinery, computer and electronic products; electrical equipment; appliances and components; transportation equipment; furniture and related products; and miscellaneous manufacturing. Production-based industries For the aerospace and shipbuilding industries, the value of production is used instead of the value of sales of goods manufactured. The value of production is calculated by adjusting monthly sales of goods manufactured by the monthly change in inventories of goods in process and finished products manufactured. The value of production is used because of the extended period of time that it normally takes to manufacture products in these industries. Unfilled orders are a stock of orders that will contribute to future sales, assuming that the orders are not cancelled. New orders are those received, whether sold in the current month or not. New orders are measured as the sum of sales for the current month plus the change in unfilled orders from the previous month to the current month. Manufacturers reporting sales, inventories and unfilled orders in US dollars Some Canadian manufacturers report sales, inventories and unfilled orders in US dollars. These data are then converted to Canadian dollars as part of the data production cycle. For sales, based on the assumption that they occur throughout the month, the average monthly exchange rate for the reference month established by the Bank of Canada is used for the conversion. The monthly average exchange rate is available in table 33-10-0163-01. Inventories and unfilled orders are reported at the end of the reference period. For most respondents, the daily average exchange rate on the last working day of the month is used for the conversion of these variables. However, some manufacturers choose to report their data as of a day other than the last working day of the month. In these instances, the daily average exchange rate on the day selected by the respondent is used. Note that because of exchange rate fluctuations, the daily average exchange rate on the day selected by the respondent can differ from both the exchange rate on the last working day of the month and the monthly average exchange rate. Daily average exchange rate data are available in table 33-10-0036-01. Revision policy Each month, the Monthly Survey of Manufacturing releases preliminary data for the reference month and revised data for the previous three months. Revisions are made to reflect new information provided by respondents and updates to administrative data. Once a year, a revision project is undertaken to revise multiple years of data. Real-time data tables Real-time data tables 16-10-0118-01, 16-10-0119-01, 16-10-0014-01 and 16-10-0015-01 will be updated on February 24. Next release Data from the Monthly Survey of Manufacturing for January 2022 will be released on March 15, 2022. Contact information Industry Intelligence Editor's Note: This press release omits select charts and/or marketing language for editorial clarity. Click here to view the full report. 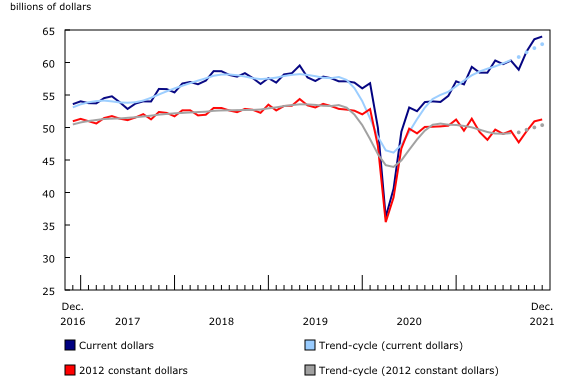
Based on respondent feedback, the flooding in British Columbia had moderate impacts on manufacturing activities in December. At the national level, the floods impacted about 23.7% of manufacturing plants mainly through disruptions in transportation (15.9%) and shortages of raw materials (12.3%). The lost sales due to the floods were estimated at about $209.6 million in December and were more pronounced in the wood product industry (-$46.2 million).
Sales of plastic and rubber products rose 11.8% to a record-high $3.5 billion in December, mainly driven by higher seasonal demand for plastic products, as volume sales increased 10.2%. Sales in the plastic and rubber industry rose 7.8% in the fourth quarter.
Manufacturing sales increased in seven provinces in December, led by Ontario and Alberta. Meanwhile, Quebec posted the largest decline.
Manufacturing sales increased in 5 of 12 census metropolitan areas (CMAs) in December, led by Toronto. Montréal posted the largest decline.
Total inventories increased 1.7% to a record-high $102.8 billion in December, mainly on higher inventories of transportation equipment (+2.6%) and machinery (+4.4%).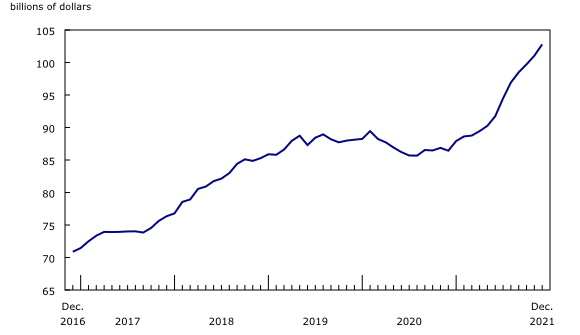
The total value of unfilled orders rose 1.7% to $97.9 billion in December, mostly due to higher unfilled orders of aerospace products and parts.
The capacity utilization rate (not seasonally adjusted) for the total manufacturing sector decreased from 78.2% in November to 77.1% in December, on lower production.
Summary: Sales rebound while inventories accumulate
After a tumultuous 2020, where manufacturing sales fell to their lowest levels since 2015, a rebound in 2021 saw manufacturing sales reach their highest level on record. This reflected higher domestic and international demand as economies began to re-open. However, 2021 was also marked by significant supply chain issues, such as shortages of microchips, plastic resins and petrochemicals, and other raw materials, as well as increases in the price of metals, wood products and foods. This led to a pronounced resurgence of inflation which pushed up the price of raw materials as well as intermediate goods used in production, both of which were reflected in the higher value of manufacturing sales and inventories.
The petroleum and coal industry was the largest contributor to the increase of non-durable goods, as year-over-year sales were up 58.9% in current dollars and 12.0% in constant dollars. Prices were impacted by increased global demand for petroleum and higher exports of energy products. The average prices for refined petroleum energy products rose 47.0% in 2021.
The transportation equipment industry posted the only annual decline (-10.4%) among all 21 manufacturing industries. Motor vehicle was the largest contributor to this decline, down 18.1% to $36.6 billion in 2021. The worldwide shortage of semiconductor chips constrained activity in the motor vehicle and part industries as temporary shutdowns and the ramping down of production occurred throughout the year at auto assembly plants and, as a result, many auto part manufacturers correspondingly reduced their production. Total exports of motor vehicle and parts declined 4.3% in 2021 accordingly. The aerospace product and parts industry, which was impacted by pandemic-related travel restrictions, posted a 13.8% decline in production in 2021 as aircraft manufacturers faced lower demand coupled with production disruptions. Overall, the aerospace product and parts industry also posted the largest decline in inventories, down 10.3% year over year.
Monthly data in this release are seasonally adjusted and are expressed in current dollars, unless otherwise specified.
For more information, or to enquire about the concepts, methods or data quality of this release, contact us (toll-free 1-800-263-1136; 514-283-8300; infostats@statcan.gc.ca) or Media Relations (statcan.mediahotline-ligneinfomedias.statcan@statcan.gc.ca).
* All content is copyrighted by Industry Intelligence, or the original respective author or source. You may not recirculate, redistrubte or publish the analysis and presentation included in the service without Industry Intelligence's prior written consent. Please review our terms of use.


