OTTAWA
,
October 16, 2023
(press release)
–
Canadian manufacturing sales rose 0.7% to $72.4 billion in August on higher sales in 9 of 21 subsectors, led by the petroleum and coal (+10.5%), food (+1.5%) and machinery (+2.4%) subsectors. This was the second consecutive monthly increase. Meanwhile, sales of fabricated metals (-3.5%) and miscellaneous (-9.4%) declined the most in August. The monthly increase was due mostly to higher prices as sales in real terms decreased in August (-0.7%). The Industrial Product Price Index rose 1.3%. Chart 1: Manufacturing sales Impacts of the port strike on manufacturing activities Petroleum and coal subsector posts the largest increase Sales of food products rose 1.5% to $12.6 billion in August, the highest level on record. Excluding the seafood product preparation and packaging industry group, sales increased in all the food industry groups, led by bakeries and tortilla (+14.1%) and meat products (+5.2%). Both higher demand and prices of bakeries and tortilla products (+1.5%) and meat products (+1.8%) were responsible for the increases in sales. In constant dollar terms, sales of food increased 0.9% in August from the previous month, while year over year, sales in current dollar terms were up 4.6%. Sales in the machinery subsector increased 2.4% to a record high, reaching $4.8 billion in August, mainly on higher sales of industrial machinery (+32.8%). Exports of industrial machinery, equipment and parts rose 1.2% accordingly. On a year-over-year basis, sales of machinery were up 15.1% in August. Partially offsetting the monthly increases, sales of fabricated metal products declined 3.5% to $4.5 billion in August, following a 3.1% increase in July, with the August decline mainly driven by lower sales of other fabricated metal products as well as architectural and structural metals manufacturing. Despite the monthly decline, sales were 5.1% higher on a year-over-year basis in August. Sales increase in seven provinces, led by Alberta and Manitoba In Alberta, sales rose for the second consecutive month, up 6.0% to $8.7 billion in August. The monthly increase was largely driven by higher sales of petroleum products (+16.4%), which also contributed significantly to higher total sales in Edmonton (+12.3%). Sales in Manitoba rose 10.0% to $2.2 billion in August, following a 12.1% decline in July. Higher sales of chemical products, transportation equipment and food subsectors contributed the most to the gain. The transportation equipment and chemical subsectors were also mainly responsible for higher total sales in Winnipeg (+17.3%) in August. Sales in Quebec fell 1.8% to $17.5 billion in August, on lower sales in 13 of 21 subsectors, led by the primary metal subsector (-11.0%). The decline in the subsector was partially attributable to lower prices of aluminum in August. Despite the monthly decline, total sales in Quebec were 3.0% higher on a yearly basis in August. Total inventories edge down Chart 2: Inventory levels edge down The inventory-to-sales ratio decreased from 1.70 in July to 1.69 in August. This ratio measures the time, in months, that would be required to exhaust inventories if sales were to remain at their current level. Chart 3: The inventory-to-sales ratio decreases Unfilled orders increase Chart 4: Unfilled orders increase Capacity utilization rate increases Chart 5: The capacity utilization rate increases Annual Survey of Manufacturing Industries preliminary estimates for 2022 Note that these advance preliminary estimates will be revised with the upcoming official release of the Annual Survey of Manufacturing Industries. For information on why the Annual Survey of Manufacturing Industries estimates may differ from the Monthly Survey of Manufacturing, please consult the webpage Differences between the Annual Survey of Manufacturing Industries and the Monthly Survey of Manufacturing. Note to readers Seasonally adjusted data are data that have been modified to eliminate the effect of seasonal and calendar influences to allow for more meaningful comparisons of economic conditions from period to period. For more information on seasonal adjustment, see Seasonally adjusted data – Frequently asked questions. Trend-cycle estimates are included in selected charts as a complement to the seasonally adjusted series. These data represent a smoothed version of the seasonally adjusted time series and provide information on longer-term movements, including changes in direction underlying the series. For information on trend-cycle data, see Trend-cycle estimates – Frequently asked questions. Both seasonally adjusted data and trend-cycle estimates are subject to revision as additional observations become available. These revisions could be large and could even lead to a reversal of movement, especially for reference months near the end of the series or during periods of economic disruption. Non-durable goods industries include food; beverage and tobacco products; textile mills; textile product mills; apparel; leather and allied products; paper; printing and related support activities; petroleum and coal products; chemicals; and plastics and rubber products. Durable goods industries include wood products; non-metallic mineral products; primary metals; fabricated metal products; machinery; computer and electronic products; electrical equipment, appliances and components; transportation equipment; furniture and related products; and miscellaneous manufacturing. Production-based industries For the aerospace and shipbuilding industry groups, the value of production is used instead of the value of sales of goods manufactured. The value of production is calculated by adjusting monthly sales of goods manufactured by the monthly change in inventories of goods in process and finished products manufactured. The value of production is used because of the extended period of time that it normally takes to manufacture products in these industries. Unfilled orders are a stock of orders that will contribute to future sales, assuming that the orders are not cancelled. New orders are those received, whether sold in the current month or not. New orders are measured as the sum of sales for the current month plus the change in unfilled orders from the previous month to the current month. Manufacturers reporting sales, inventories and unfilled orders in US dollars Some Canadian manufacturers report sales, inventories and unfilled orders in US dollars. These data are then converted to Canadian dollars as part of the data production cycle. For sales, based on the assumption that they occur throughout the month, the average monthly exchange rate for the reference month established by the Bank of Canada is used for the conversion. The monthly average exchange rate is available in table 33-10-0163-01. Inventories and unfilled orders are reported at the end of the reference period. For most respondents, the daily average exchange rate on the last working day of the month is used for the conversion of these variables. However, some manufacturers choose to report their data as of a day other than the last working day of the month. In these instances, the daily average exchange rate on the day selected by the respondent is used. Note that because of exchange rate fluctuations, the daily average exchange rate on the day selected by the respondent can differ from both the exchange rate on the last working day of the month and the monthly average exchange rate. Daily average exchange rate data are available in table 33-10-0036-01. Revision policy Each month, the Monthly Survey of Manufacturing releases preliminary data for the reference month and revised data for the previous three months. Revisions are made to reflect new information provided by respondents and updates to administrative data. Once a year, a revision project is undertaken to revise multiple years of data. Real-time data tables Real-time data tables 16-10-0118-01, 16-10-0119-01, 16-10-0014-01 and 16-10-0015-01 will be updated on October 23. Next release Data from the Monthly Survey of Manufacturing for September will be released on November 15. Contact information Industry Intelligence Editor's Note: This press release omits select charts and/or marketing language for editorial clarity. Click here to view the full report.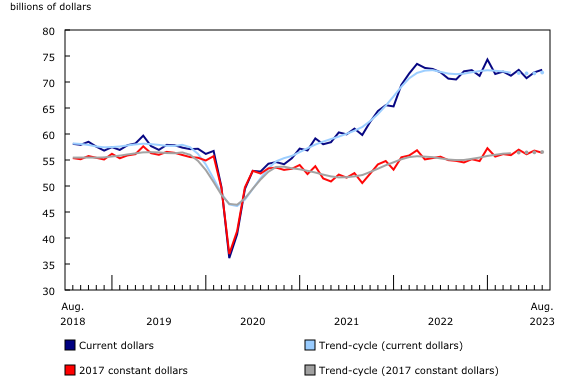
The impact of the port strike in British Columbia on the manufacturing sector was smaller in August compared with July. At the national level, 8.4% of manufacturing plants reported that their manufacturing activities were impacted by the strike in August, mainly through shortages of raw materials (5.0%) and transportation disruptions (3.7%).
Sales of petroleum and coal products rose for the second consecutive month, up 10.5% to $8.4 billion in August, on higher volumes and prices. Sales in constant dollar terms increased 1.7% in August, while prices of refined petroleum energy product (including liquid biofuels) rose 10.6%. Concerns over continuing oil production cuts by the Organization of the Petroleum Exporting Countries and its partners (OPEC+) resulted in increased prices of petroleum products. Exports of refined petroleum energy products also saw a substantial growth, up 23.1% in August. Despite the monthly increase, sales of petroleum and coal products in current dollars were down 13.5% on a yearly basis in August.
Manufacturing sales increased in seven provinces in August, led by Alberta (+6.0%) and Manitoba (+10.0%). Quebec (-1.8%) experienced the largest decrease.
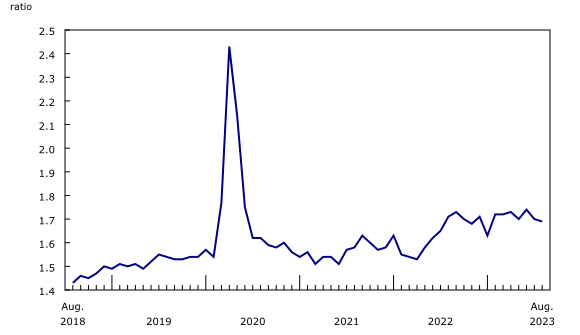
Total inventory levels edged down 0.1% to $122.2 billion in August, the lowest level since January 2023. The decline in August occurred because of lower raw materials (-0.6%) and finished products (-0.1%). Lower inventories of chemical products (-3.8%) and primary metals (-2.5%) were mainly responsible for the decline.
Unfilled orders rose 0.5% to $103.8 billion in August, largely on higher unfilled orders of aerospace product and parts (+2.7%). As recovery continues in the aerospace industry, driven by higher demand and market confidence, aerospace manufacturers face higher backlog orders which give them incentives to expand their manufacturing operations.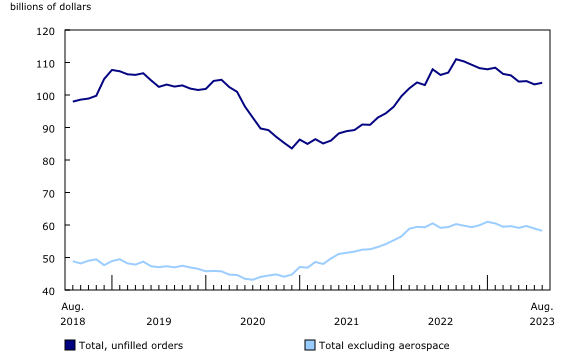
The capacity utilization rate (not seasonally adjusted) for the total manufacturing sector increased from 77.6% in July to 80.2% in August, on higher production. The gains in the capacity utilization rates were noticeable in the transportation equipment (+4.8 percentage points), petroleum and coal (+2.0 percentage points), and machinery (+5.8 percentage points) subsectors. The capacity utilization rate of primary metal manufacturing declined 1.0 percentage point in August.
A few preliminary 2022 estimates from the Annual Survey of Manufacturing Industries are available and indicate that revenue of goods manufactured has increased 17.1% from 2021. Total revenue is estimated at $923.7 billion, while revenue from goods manufactured reached $866.3 billion and total expenses grew to $827.4 billion.
Monthly data in this release are seasonally adjusted and are expressed in current dollars, unless otherwise specified.
For more information, or to enquire about the concepts, methods or data quality of this release, contact us (toll-free 1-800-263-1136; 514-283-8300; infostats@statcan.gc.ca) or Media Relations (statcan.mediahotline-ligneinfomedias.statcan@statcan.gc.ca).
* All content is copyrighted by Industry Intelligence, or the original respective author or source. You may not recirculate, redistrubte or publish the analysis and presentation included in the service without Industry Intelligence's prior written consent. Please review our terms of use.


