OTTAWA
,
June 20, 2023
(press release)
–
Job vacancies and job vacancy rate continue to fall in the first quarter Meanwhile, payroll employment increased by 89,200 (+0.5%) in the first quarter of 2023, the eighth consecutive quarterly increase. The quarter-over-quarter growth rate in total labour demand (the sum of filled and vacant positions) was 0.3% in the first quarter, down from 1.0% in the first quarter of 2022. The job vacancy rate—which corresponds to the number of vacant positions as a proportion of total labour demand—fell by 0.2 percentage points to 4.7% in the first quarter of 2023. This was the third consecutive decrease and the lowest rate since the second quarter of 2021 (4.3%). Infographic 1: Payroll employment continues to increase, while vacant positions have decreased since the second quarter of 2022 Labour market tightness eases as unemployment-to-job vacancy ratio edges up Infographic 2: Labour market tightness eases as job vacancies continue to decline Growth in average offered hourly wage decelerates in the first quarter Part of the increase in the average offered hourly wage in the first quarter was attributable to a shift in the relative composition of job vacancies, from occupations offering lower wages to occupations offering higher wages. Using a method that holds the composition of job vacancies by occupation at the average of the first quarter of 2022, year-over-year offered hourly wage growth was 3.5% in the first quarter of 2023, down from 5.9% in the previous quarter. Occupations with higher growth of their average hourly offered wage in the first quarter included labourers in food and beverage processing (+9.7% to $18.70); material handlers (+9.3% to $20.05); and nurse aides, orderlies and patient service associates (+6.3% to $21.90). In contrast, plasterers, drywall installers and finishers and lathers (-13.6% to $26.30) and human resources and recruitment officers (-11.3% to $24.75) recorded negative growth rates in hourly offered wages in the first quarter on a year-over-year basis. Job vacancies decline in half of broad occupation groups and hold steady in the other half Previously released data from the Labour Force Survey show that, in the first quarter, employment increased in trades, transport and equipment operators and related occupations by 100,600 (+3.4%) and business, finance and administration occupations by 47,000 (+1.5%). Concurrently, employment was little changed in occupations in manufacturing and utilities. Meanwhile, job vacancies in the first quarter were little changed in the remaining five broad occupational groups, including sales and service (280,600 vacancies representing 33.3% of total vacancies); health occupations (95,200; 11.3%); and occupations in education, law and social, community and government services (63,400; 7.5%). Chart 1: Fewer job vacancies in half of broad occupational groups in the first quarter Widespread year-over-year decreases in vacancies across broad occupation groups The year-over-year drop in vacancies in sales and service occupations in the first quarter was driven by food counter attendants, kitchen helpers and related support occupations (-11,600 to 49,400); retail salespersons (-7,700 to 27,500); and food and beverage servers (-5,900 to 13,100). Almost all the unfilled positions in these three occupations (97.4% in the first quarter 2023) require a high school diploma or less (not seasonally adjusted). Year-over-year rises in the broad health occupational group in the first quarter included registered nurses and registered psychiatric nurses (+5,500 to 28,300); licensed practical nurses (+2,300 to 13,600); and nurse aides, orderlies and patient service associates (+1,800 to 23,700). Together, these three occupations accounted for nearly three-quarters (71.2%) of all vacancies in health occupations in the first quarter. The bulk (91.9%) of these unfilled positions required a college or a university diploma (not seasonally adjusted). Large decline in the number of vacancies requiring lower level of education In the first quarter of 2023, there was an average of 1.1 unemployed persons for every unfilled position requiring a trades certificate or diploma, slightly up from 1.0 in the same quarter of 2022. This was the lowest unemployment-to-job vacancy ratio among the four job vacancy groups defined by the minimum educational level required. Vacancies requiring a trades certificate or diploma also recorded the lowest proportional decrease in vacancies (-6.1%; -6,600) and the highest growth rate in its average hourly wage (+5.3% to $28.05) on a year-over-year basis in the first quarter. In comparison, there were 269,700 unemployed persons with a bachelor's degree or higher, but 107,200 job vacancies required this education level, resulting in 2.5 unemployed persons per vacancy in the first quarter of 2023 for this job vacancy group. Despite this, the number of vacancies requiring a bachelor's degree or higher (-6.6%; -7,600) decreased at a slower pace than the number of vacancies requiring a high school diploma or less (-16.0%; -82,800). Infographic 3: Large decrease of unfilled positions requiring high school diploma or less Job vacancies down in 10 of 69 economic regions At the regional level, job vacancies fell in 10 of 69 economic regions in the first quarter, led by Toronto, Ontario (-18,000 to 136,300); Lower Mainland–Southwest, British Columbia (-5,000 to 74,400); and Ottawa, Ontario (-3,500 to 28,400). In the first quarter, the number of unfilled positions rose slightly in four economic regions, with the largest increases recorded in Winnipeg, Manitoba (+2,600 to 18,800) and Saguenay-Lac-Saint-Jean, Quebec (+900 to 5,900). Meanwhile, job vacancies were little changed in the remaining 55 economic regions. Since the second quarter of 2022, when the overall number of job vacancies reached a record high in Canada, job vacancies have decreased in 33 economic regions. Proportionally, the economic regions of Outaouais, Quebec (-32.4% to 5,600 in the first quarter of 2023); Ottawa, Ontario (-31.5% to 28,400); Lower Mainland–Southwest, British Columbia (-29.3% to 74,400); and Banff–Jasper–Rocky Mountain House and Athabasca–Grand Prairie–Peace River, Alberta (-28.8% to 9,500) recorded the largest declines in vacancies since the second quarter of 2022. Job vacancies down in 8 of 20 broad industrial sectors On a year-over-year basis, job vacancies in accommodation and food services declined in both accommodation services (-1,900; -14.8%) and food services and drinking places (-21,600; -19.9%) in the first quarter of 2023 (not seasonally adjusted). In the first quarter, there were 64,300 vacant positions in the manufacturing sector, down by 8,600 (-11.8%) from the previous quarter. This was the fourth consecutive quarterly decline since the first quarter of 2022, when the number of vacancies in the manufacturing sector reached a record high of 86,400. On a year-over-year basis, job vacancies fell in 13 of the 21 subsectors in manufacturing in the first quarter of 2023. Food manufacturing (-3,800; -25.0%) recorded the largest decline, followed by fabricated metal product manufacturing (-3,500; -30.4%) (not seasonally adjusted). The number of vacancies also declined in six other sectors in the first quarter, including finance and insurance (-6,300; -17.0%); professional, scientific and technical services (-5,500; -9.5%), and construction (-5,100; -6.6%). Meanwhile, job vacancies increased in four sectors in the first quarter, led by administrative and support, waste management and remediation services (+8,000; +18.2%). At the same time, there was little change in the remaining eight sectors, including healthcare and social assistance (144,200) and retail trade (96,600). Note to readers Estimates by sector are based on the North American Industry Classification System 2017 Version 3.0. Estimates by geographical area are based on the Standard Geographical Classification 2016. Estimates by occupation reflect the National Occupational Classification (NOC) 2016 Version 1.3. The NOC is a four-tiered hierarchical structure of occupational groups with successive levels of disaggregation. The structure is as follows: (1) 10 broad occupational categories, also referred to as one-digit NOC; (2) 40 major groups, also referred to as two-digit NOC; (3) 140 minor groups, also referred to as three-digit NOC; and (4) 500 unit groups, also referred to as four-digit NOC. Because of the COVID-19 pandemic, data collection for the JVWS was suspended for the second and third quarters of 2020 In January 2020, a new electronic questionnaire was introduced. Minor changes to the content are documented in the most recent Guide to the Job Vacancy and Wage Survey (Catalogue number75-514-G). Beginning with the reference period of October 2020, preliminary monthly estimates from the JVWS are released on a monthly basis alongside the Survey of Employment, Payrolls and Hours release. These estimates provide information on the number of job vacancies and the job vacancy rate by province and by industrial sector. The target population of the survey includes all business locations in Canada, excluding those involved primarily in religious organizations and private households. Federal, provincial and territorial, as well as international and other extraterritorial public administrations are also excluded from the survey. Unless otherwise stated, this release presents seasonally adjusted estimates, which facilitate comparisons by removing the effects of seasonal variations. For more information on seasonal adjustment, see Seasonally adjusted data – Frequently asked questions. Seasonally adjusted quarterly job vacancy data are available online (tables 14-10-0398-01, 14-10-0399-01 and 14-10-0400-01). The analyses of the job vacancy levels and rates by sector (20 broad industrial sector groups), one-digit NOC (10 broad occupational categories), province and economic region are based on seasonally adjusted data. However, the analyses of the job vacancy levels and rates by subsector, two-digit NOC, three-digit NOC and four-digit NOC are based on non-seasonally adjusted data. This analysis focuses on differences between estimates that are statistically significant at the 68% confidence level. Next release Products The product "Labour Market Indicators, by province, territory and economic region, unadjusted for seasonality" (Catalogue number71-607-X) is also available. This dynamic web application provides access to Statistics Canada's labour market indicators for Canada, by province, territory and economic region, and allows users to view a snapshot of key labour market indicators, observe geographical rankings for each indicator using an interactive map and table, and easily copy data into other programs. Contact information Industry Intelligence Editor's Note: This press release omits select charts and/or marketing language for editorial clarity. Click here to view the full report.
The number of job vacancies decreased by 33,500 (-3.8%) in the first quarter, falling to 843,200 and marking the third straight quarterly decline from the record high reached in the second quarter of 2022 (984,600).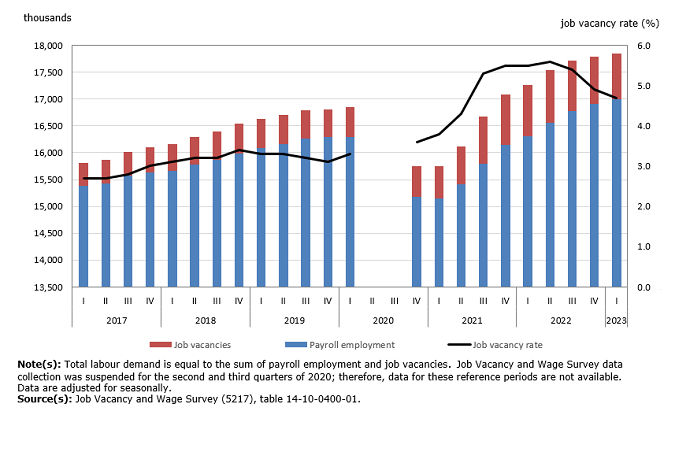
There was an average of 1.3 unemployed persons for each job vacancy in Canada in the first quarter, up from 1.2 in the previous quarter and from 1.1 in the second and the third quarters of 2022. This slight increase in the unemployment-to-job vacancy ratio is due to the downward trend of job vacancies over the last quarters, as the number of unemployed persons (measured in the Labour Force Survey) has remained relatively stable since October 2022. This indicates that while the labour market tightness continued in the first quarter of 2023, there are signs of a gradual easing in its severity. In comparison, the unemployment-to-job vacancy ratio was sitting at 2.4 in the first quarter of 2020.
On a year-over-year basis, the average offered hourly wage increased 5.0% to $25.40 in the first quarter, down from an increase of 8.5% to $24.90 in the previous quarter. In comparison, year-over-year average hourly wages of all employees (measured in the Labour Force Survey) grew 5.1% year over year in the first quarter of 2023 and 5.3% in the previous quarter (data used in this section are not seasonally adjusted).
In the first quarter, job vacancies decreased in 5 of the 10 broad occupational groups, led by trades, transport and equipment operators and related occupations (-10,900 to 142,800), business, finance and administration occupations (-8,900 to 90,200) and occupations in manufacturing and utilities (-5,800 to 36,400).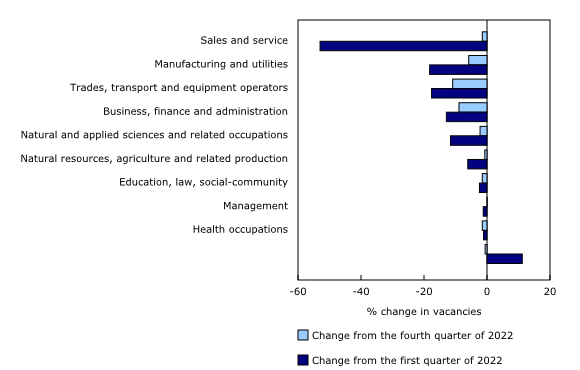
On a year-over-year basis, job vacancies fell in 7 of the 10 broad occupational groups in the first quarter, led by sales and service occupations (-53,000; -15.9%), which accounted for nearly half (46.7%) of the total decrease in vacancies (-113,400; -11.9%) since the first quarter of 2022. These declines were moderated by increases in vacancies in health occupations (+11,200; +13.3%) in the first quarter of 2023, the only broad occupational group which recorded a year-over-year rise in vacancies. There was little change in the remaining two broad occupational groups.
In the first quarter, year-over-year drops in job vacancies were observed across all the educational levels sought by employers. However, the largest proportional decline was recorded in positions requiring a high school diploma or less (-16.0%; -82,900). The unemployment-to-job vacancy ratio for these vacancies was 1.2 in the first quarter, up from 1.1 in the same quarter of 2022 (data used in this section are not seasonally adjusted).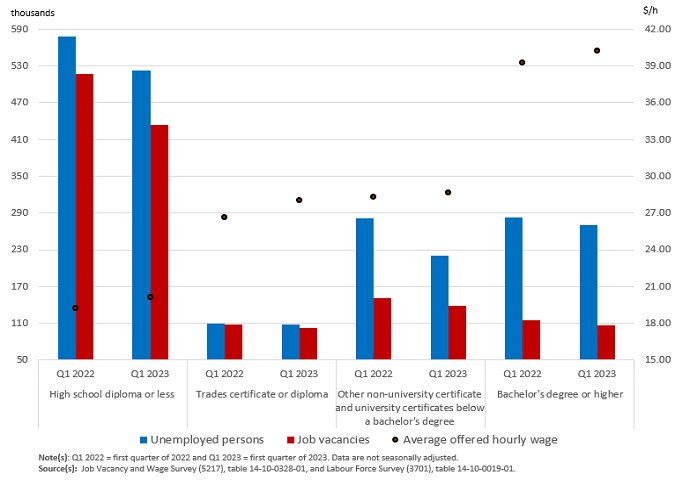
In the first quarter, job vacancies decreased in three provinces: Ontario (-25,100 to 298,800), British Columbia (-7,200 to 126,300) and Alberta (-4,300 to 93,300). Meanwhile, the number of vacancies increased in Manitoba (+2,200 to 28,300) and was little changed in the remaining provinces and in the territories.
The number of unfilled positions in the accommodation and food services sector declined by 13,000 (-10.5%) to 110,300 in the first quarter, bringing the total decrease since the second quarter of 2022 to 35,200 (-24.2%).
The Job Vacancy and Wage Survey (JVWS) provides comprehensive data on job vacancies and offered wages by industrial sector and detailed occupation for Canada and the provinces, territories and economic regions. Job vacancy and offered wage data are released quarterly.
Data on job vacancies from the JVWS for the second quarter will be released on September 19.
More information about the concepts and use of data from the Job Vacancy and Wage Survey is available online in the Guide to the Job Vacancy and Wage Survey (Catalogue number75-514-G).
For more information, or to enquire about the concepts, methods or data quality of this release, contact us (toll-free 1-800-263-1136; 514-283-8300; infostats@statcan.gc.ca) or Media Relations (statcan.mediahotline-ligneinfomedias.statcan@statcan.gc.ca).
* All content is copyrighted by Industry Intelligence, or the original respective author or source. You may not recirculate, redistrubte or publish the analysis and presentation included in the service without Industry Intelligence's prior written consent. Please review our terms of use.


