OTTAWA
,
October 17, 2022
(press release)
–
Investment in building construction increased 0.4% to $21.1 billion in August, with most of the gains coming from British Columbia. The residential sector rose 0.5% to $15.7 billion, while the non-residential sector declined 0.2% to $5.3 billion. On a constant dollar basis (2012=100), investment in building construction decreased 0.2% to $12.7 billion. Chart 1: Investment in building construction, seasonally adjusted British Columbia drives residential sector Single-family home investment rose 0.6% to $8.6 billion and has remained relatively stable over the last six months. Multi-unit construction investment for the month increased 0.5% to $7.2 billion, with significant gains from British Columbia (+10.6%). Multiple new apartment projects spanning across Vancouver helped contribute to the growth. Infographic 1: Investment in residential building construction, August 2022 Chart 2: Investment in residential building construction, seasonally adjusted Minor decline in non-residential sector Investment in the industrial component rose 0.9% to $1.0 billion in August, a ninth consecutive monthly increase. Overall, seven provinces reported gains, led by Quebec. Commercial investment edged up 0.1% to $3.0 billion. Alberta led the gains, as it continued to show significant growth over the last 12 months, up 20.2% year over year in August. Institutional construction investment declined 1.4% to $1.3 billion. Most of the weakness came from Ontario as investment decreased for the second consecutive month in this component. Conversely, Prince Edward Island saw an 88.8% increase for institutional buildings with the construction of a new elementary school in Charlottetown contributing to most of the gains. Infographic 2: Investment in non-residential building construction, August 2022 For more information on housing, please visit the Housing statistics portal. Note to readers Data presented in this release are seasonally adjusted with current dollar values unless otherwise stated. Using seasonally adjusted data allows month-to-month and quarter-to-quarter comparisons by removing the effects of seasonal variations. For information on seasonal adjustment, see Seasonally adjusted data – Frequently asked questions. Monthly estimates in constant dollars are calculated using quarterly deflators from the Building Construction Price Index (table 18-10-0135-01). Typically, the first two months of a quarter use the previous quarter's price level, and the data are revised when the new quarterly price index becomes available. Detailed data on investment activity by type of building and type of work are now available in the unadjusted current dollar series. The Trade and Services subcomponent includes buildings such as retail and wholesale outlets, retail complexes and motor vehicle show rooms. More detailed information can be found on the Integrated Metadatabase at Types of Building Structure - 2.2.1 - Trade and services. Next release Products Contact information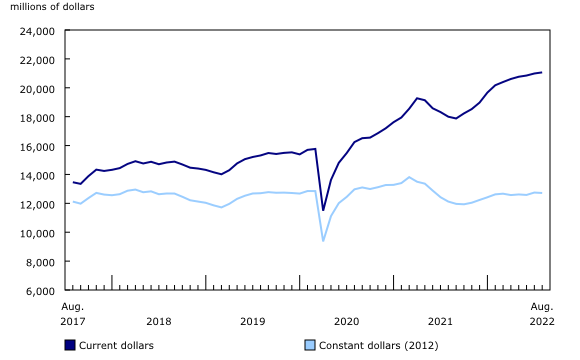
Investment in residential building construction was up 0.5% to $15.8 billion in August, led by British Columbia (+5.0%).

Investment in non-residential construction edged down 0.2% to $5.3 billion.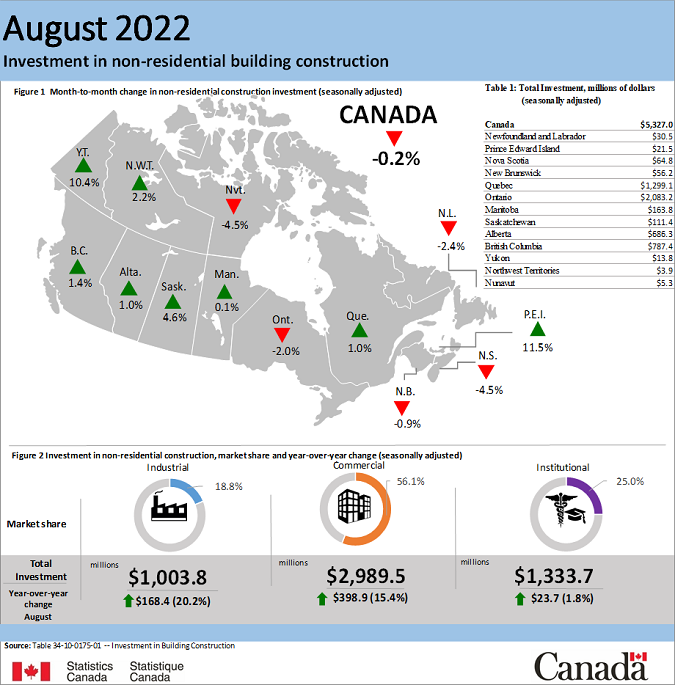
Data are subject to revisions based on late responses, methodological changes and classification updates. Unadjusted data has been revised for the previous two months. Seasonally adjusted data has been revised for the previous three months.
Data on investment in building construction for September will be released on November 14th.
Statistics Canada has a "Housing Market Indicators" dashboard. This web application provides access to key housing market indicators for Canada, by province and by census metropolitan area. These indicators are automatically updated with new information from monthly releases, giving users access to the latest data.
For more information, or to enquire about the concepts, methods or data quality of this release, contact us (toll-free 1-800-263-1136; 514-283-8300; infostats@statcan.gc.ca) or Media Relations (statcan.mediahotline-ligneinfomedias.statcan@statcan.gc.ca).
* All content is copyrighted by Industry Intelligence, or the original respective author or source. You may not recirculate, redistrubte or publish the analysis and presentation included in the service without Industry Intelligence's prior written consent. Please review our terms of use.


