OTTAWA
,
March 22, 2022
(press release)
–
The Industrial Product Price Index rose 3.1% month over month in February and 16.4% year over year. The Raw Materials Price Index rose 6.0% month over month in February and 29.8% year over year. Chart 1: Prices for industrial products increase Industrial Product Price Index In February, prices for energy and petroleum products rose 8.5% month over month and 44.6% compared with the same month in 2021. The price of motor gasoline exiting refineries in Canada was up 8.0% in February on a month-over-month basis, and was 42.1% higher than February 2021. The price of diesel fuel exiting refineries in Canada rose 9.2% month over month and 47.8% year over year. These increases were mostly attributable to higher prices for crude oil. Russia's aggression against Ukraine and sanctions against Russia contributed to market uncertainty about oil supply going forward. This occurred while global oil inventories were low. According to the U.S. Energy Information Administration, commercial oil inventories in the Organisation for Economic Co-operation and Development were at their lowest level since mid-2014. Prices for primary non-ferrous metal products rose 5.7% in February, led mainly by higher prices for unwrought aluminum and aluminum alloys which rose 10.6% month over month and 39.8% year over year. Basic and semi-finished products of aluminum and aluminum alloys (+14.5%) also contributed to the monthly increase in this group. Global aluminum supplies tightened in February as higher energy prices led to production curtailments at European smelters, despite continued demand. Inventories in Shanghai, as well as in London Metal Exchange (LME) warehouses, have fallen since the start of 2022. The benchmark price of aluminum at the LME hit its highest level since 2008 on February 8.In addition to high energy costs, uncertainty about future supply from Russia also drove up the price of aluminum. Prices for unwrought gold, silver, and platinum group metals, and their alloys (+3.3%) were also up compared to January. The price of softwood lumber was up 8.3% month over month in February, a fifth consecutive monthly increase, which followed a large drop between May and August. On a year-over-year basis, softwood lumber was 31.2% higher than February 2021. Steady demand, transportation problems, and labour issues all contributed to the persisting high prices for Canadian softwood lumber. Prices for intermediate food products rose 3.3% month over month in February and 27.9% year over year. This was the 25th consecutive month of year-over-year increases for this commodity group. Prices for soybean oil were up 24.2% month over month and 157.2% compared with February 2021. This was partially attributable to unfavourable weather conditions in Brazil, the world's top global producer and exporter of soybeans. Prices for ammonia and chemical fertilizers rose 0.5% month over month in February, a 10th consecutive monthly increase. On a year-over-year basis, prices for this product group were up by 88.2%. Raw Materials Price Index Prices for conventional crude oil were up 12.1% month over month in February and 58.4% year over year. According to estimates from the U.S. Energy Information Administration's short-term energy outlook, global petroleum consumption outpaced global supply for the 13th consecutive month in February. Amidst this imbalance, uncertainty due to the Russia's aggression against Ukraine and its consequences on energy supply drove oil prices up. Prices for metal ores, concentrates and scrap increased 3.8% on a monthly basis. Within this group, prices for iron ores and concentrates rose 8.6%. Gold ores, concentrates and mill billion (+2.9%), as well as silver ores, concentrates and mill bullion (+2.3%), also posted monthly increases. Higher prices for hogs (+10.6%) and unprocessed milk (+6.3%) led the rise in animals and animal products (+3.2%). Hog prices rose due to tightness in market supply, while unprocessed milk prices rose following a review by the Canadian Dairy Commission of Canadian farm gate milk prices and various other costs used in administering the supply management system. Chart 2: Prices for raw materials rise Note to readers With each release, data for the previous six months may have been revised. The indexes are not seasonally adjusted. The IPPI reflects the prices that producers in Canada receive as goods leave the plant gate. The IPPI does not reflect what the consumer pays. Unlike the Consumer Price Index, the IPPI excludes indirect taxes and all costs that occur between the time a good leaves the plant and the time the final user takes possession of the good. This includes transportation, wholesale and retail costs. Canadian producers export many goods. They often indicate their prices in foreign currencies, especially in US dollars, and these prices are then converted into Canadian dollars. This is particularly the case for motor vehicles, pulp and paper products, and wood products. Therefore, fluctuations in the value of the Canadian dollar against its US counterpart affect the IPPI. However, the conversion to Canadian dollars reflects only how respondents provide their prices. This is not a measure that takes into account the full effect of exchange rates. The conversion of prices received in US dollars is based on the average monthly exchange rate established by the Bank of Canada and available in Table 33-10-0163-01 (series v111666275). Monthly and annual variations in the exchange rate, as described in the release, are calculated according to the indirect quotation of the exchange rate (for example, CAN$1 = US$X). The RMPI reflects the prices paid by Canadian manufacturers for key raw materials. Many of those prices are set on the world market. However, as few prices are denominated in foreign currencies, their conversion into Canadian dollars has only a minor effect on the calculation of the RMPI. Products Statistics Canada launched the Producer Price Indexes Portal as part of a suite of portals for prices and price indexes. This webpage provides Canadians with a single point of access to a variety of statistics and measures related to producer prices. The video "Producer price indexes" is available on the Statistics Canada Training Institute webpage. It provides an introduction to Statistics Canada's producer price indexes—what they are, how they are made, and what they are used for. Addition of a new table and additional data Next release Contact information Industry Intelligence Editor's Note: This press release omits select charts and/or marketing language for editorial clarity. Click here to view the full report.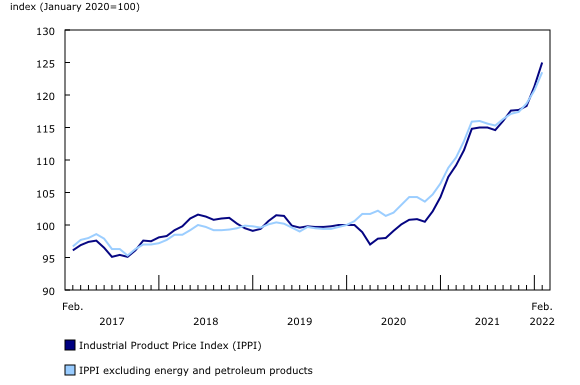
In February 2022, the Industrial Product Price Index rose 3.1% month over month and 16.4% year over year. This was the sixth consecutive monthly increase, and the largest monthly gain in more than 42 years, since January 1980 (+3.8%).
In February, the Raw Materials Price index rose 6.0% month over month and 29.8% year over year.
The Industrial Product Price Index (IPPI) and the Raw Materials Price Index (RMPI) are available at the Canada level only. Selected commodity groups within the IPPI are also available by region.
The product "Industrial Product Price Index: 2021 Annual Review" is now available. This document is a review of how producer prices, as measured by the IPPI, changed in 2021 compared with 2020. The year 2021 faced a multitude of factors influencing prices, many of which stemmed from the COVID-19 pandemic. Economies reopened slowly as lockdowns were lifted and vaccinations became available, driving up demand.
Effective February 28, 2022, table 18-10-0272-01 has been added to the Statistics Canada website featuring regional indexes for select refined petroleum products. In addition, tables 18-10-0266-01 and 18-10-0268-01 now contain data for select 6- and 7-digit North American Product Classification System series.
The industrial product and raw materials price indexes for March 2022 will be released on April 22, 2022.
For more information, or to enquire about the concepts, methods or data quality of this release, contact us (toll-free 1-800-263-1136; 514-283-8300; infostats@statcan.gc.ca) or Media Relations (statcan.mediahotline-ligneinfomedias.statcan@statcan.gc.ca).
* All content is copyrighted by Industry Intelligence, or the original respective author or source. You may not recirculate, redistrubte or publish the analysis and presentation included in the service without Industry Intelligence's prior written consent. Please review our terms of use.


