OTTAWA
,
February 28, 2022
(press release)
–
Prices of products manufactured in Canada, as measured by the Industrial Product Price Index (IPPI), rose 3.0% month over month in January 2022 and were 16.9% higher than in January 2021. Prices of raw materials purchased by manufacturers operating in Canada, as measured by the Raw Materials Price Index (RMPI), were up 6.5% on a monthly basis in January 2022 and up 30.5% year over year. Chart 1: Prices for industrial products increase Industrial Product Price Index Prices for refined petroleum energy products (including liquid biofuels) rose 10.6%, after posting decreases of 4.9% in December 2021 and 1.5% in November. Compared with January 2021, prices increased 48.0% in January 2022. Prices for diesel fuel (+13.3%) and motor gasoline (+7.2%) were mostly responsible for the monthly gain. Refined petroleum product prices largely reflect the increase in crude oil prices. Prices for lumber and other sawmill products increased 14.6%, mostly on higher prices for softwood lumber, which rose 15.0% in January 2022, after a jump of 31.8% in December 2021. Compared with the same month in 2021, prices for softwood lumber were up 27.0% in January. The gain in this group was mostly driven by strong demand for wood for residential construction in the United States and Canada, combined with limited supply and major supply chain constraints. Prices for basic and semi-finished iron or steel products were up 3.7% in January. Year over year, prices rose 59.6%, a 16th consecutive year-over-year increase. Unwrought aluminum and aluminum alloys prices were up 4.9% on a monthly basis in January and 32.6% compared with the same month in 2021. Higher demand and reduced capacity of global aluminum production—due in part to a significant rise in energy costs—contributed to these gains. Prices for intermediate food products (+5.5%) also rose from December 2021, mainly on higher prices for grain and oilseed products, n.e.c. (+8.6%). Raw Materials Price Index Following two straight monthly declines, prices for conventional crude oil rose 16.0% in January 2022, their biggest monthly increase since June 2020 (+28.0%). Compared with January 2021, conventional crude oil prices rose 63.2%. Furthermore, prices for synthetic crude oil (+20.7%) were also up in January 2022. A number of factors impacted crude oil prices, such as demand outpacing supply and subsiding concerns about Omicron's effect on oil consumption. In addition, concerns about supply disruptions arose amid the escalating geopolitical tensions in Eastern Europe and the Middle East. Prices for metal ores, concentrates and scrap were up 1.3%, after falling 1.1% in December 2021. In this group, prices for iron ores and concentrates (+11.6%) increased for a second straight month in January 2022. However, they were down 22.5% from the same month in 2021. A resurgence of steel production in China contributed to this increase. Prices for logs, pulpwood, natural rubber and other forestry products rose 3.1% month over month, pushed upward mostly by prices for logs and bolts (+3.7%). Higher lumber prices observed since October 2021 were partly responsible for this increase. Chart 2: Prices for raw materials rise Price Connections: From the gas well to the farm stand According to data from the World Bank, the price of natural gas in Europe has risen by 288.8% year over year in January 2022. Europe imports the majority of its natural gas, over 80% in 2020. Gas is imported not only through pipelines but also as liquefied natural gas which can be shipped from overseas. As such, soaring prices in Europe have pulled prices up globally. The World Bank's global price index was up 170% year over year in January 2022. Domestically, the price of natural gas in Canada was up 21.2% year over year in the same period. Limited wind power generation, reduced gas exports from Russia, and maintenance at Norwegian gas fields all contributed to the supply crunch in Europe over the past year. More recently, geopolitical tensions have been increasing uncertainty as approximately 40% of Europe's natural gas is imported from Russia. Natural gas is a key ingredient used to produce fertilizers, which are crucial inputs for the agricultural sector. The latest available data from the Farm Input Price Index shows that input prices for Canadian farming were up 10.8% in the third quarter of 2021, mostly due to higher prices for fertilizer (+34.4%) and commercial feed (+28.1%). As of January 2022, prices for ammonia and chemical fertilizers were up 110.8% year over year. In addition to higher input prices, yields for crops such as canola and wheat were weakened by a severe drought in 2021. Prices for crop products were up by 39.7% year over year in January 2022. Further down the supply chain, prices received by Canadian manufacturers of intermediate food products, a category which includes cooking oils and flour, were up 27.8% year over year in January 2022. Likewise, according to the latest available data from the Wholesale Services Price Index, wholesale margins for farm products were up 25.1% year over year in the third quarter of 2021. It should be noted that although prices can move in correlation with each other, it is not possible to completely attribute a price increase in one category to another, as there are always a multitude of factors influencing prices. Note to readers With each release, data for the previous six months may have been revised. The indexes are not seasonally adjusted. The IPPI reflects the prices that producers in Canada receive as goods leave the plant gate. The IPPI does not reflect what the consumer pays. Unlike the Consumer Price Index, the IPPI excludes indirect taxes and all costs that occur between the time a good leaves the plant and the time the final user takes possession of the good. This includes transportation, wholesale and retail costs. Canadian producers export many goods. They often indicate their prices in foreign currencies, especially in US dollars, and these prices are then converted into Canadian dollars. This is particularly the case for motor vehicles, pulp and paper products, and wood products. Therefore, fluctuations in the value of the Canadian dollar against its US counterpart affect the IPPI. However, the conversion to Canadian dollars reflects only how respondents provide their prices. This is not a measure that takes into account the full effect of exchange rates. The conversion of prices received in US dollars is based on the average monthly exchange rate established by the Bank of Canada and available in Table 33-10-0163-01 (series v111666275). Monthly and annual variations in the exchange rate, as described in the release, are calculated according to the indirect quotation of the exchange rate (for example, CAN$1 = US$X). The RMPI reflects the prices paid by Canadian manufacturers for key raw materials. Many of those prices are set on the world market. However, as few prices are denominated in foreign currencies, their conversion into Canadian dollars has only a minor effect on the calculation of the RMPI. Discontinuation of Industrial Product Price Index flash estimates The monthly release of the industrial product and raw materials price indexes will soon be published earlier each month, effective with the release of February 2022 data on March 22, 2022. Products Statistics Canada launched the Producer Price Indexes Portal as part of a suite of portals for prices and price indexes. This webpage provides Canadians with a single point of access to a variety of statistics and measures related to producer prices. The video "Producer price indexes" is available on the Statistics Canada Training Institute webpage. It provides an introduction to Statistics Canada's producer price indexes—what they are, how they are made, and what they are used for. Addition of a new table and additional data Next release Contact information Industry Intelligence Editor's Note: This press release omits select charts and/or marketing language for editorial clarity. Click here to view the full report.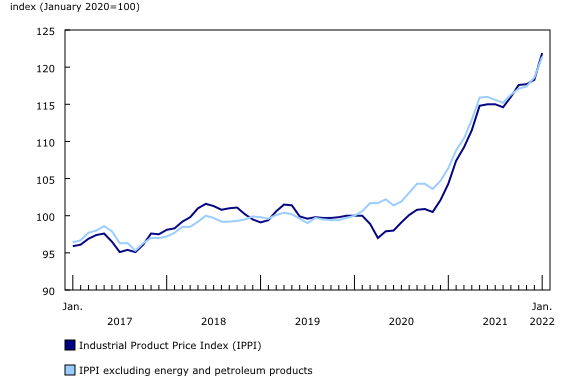
The IPPI rose 3.0% month over month in January. This was a fifth consecutive monthly gain and the strongest increase since May 2021 (+3.0%). This growth was driven mainly by higher prices for refined petroleum products and lumber and other sawmill products.
In January, the RMPI was up 6.5% month over month and 30.5% from January 2021, driven by higher prices for conventional crude oil. Excluding crude energy products, the RMPI rose 1.0%.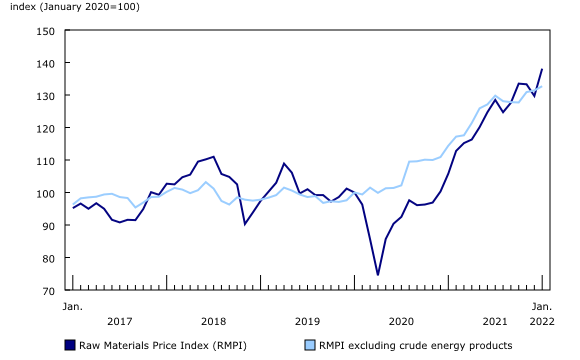
In recent months, correlations in prices observed for commodities have been illuminating the interdependence of markets and supply chains. High prices for natural gas and fertilizers have affected Canadian farmers. Natural gas is used in the production of fertilizer, which is in turn used to grow crops. Furthermore, crops are a source of food for humans and livestock.
The Industrial Product Price Index (IPPI) and the Raw Materials Price Index (RMPI) are available at the Canada level only. Selected commodity groups within the IPPI are also available by region.
The IPPI flash estimates, which have been published since March 2020, are no longer released as of January 2022. The last release was on December 14, 2021, with the publication of the November 2021 flash estimates.
The product "Industrial Product Price Index: 2021 Annual Review" is now available. This document is a review of how producer prices, as measured by the IPPI, changed in 2021 compared with 2020. The year 2021 faced a multitude of factors influencing prices, many of which stemmed from the COVID-19 pandemic. Economies reopened slowly as lockdowns were lifted and vaccinations became available, driving up demand.
Effective February 28, 2022, table 18-10-0272-01 has been added to the Statistics Canada website featuring regional indexes for select refined petroleum products. In addition, tables 18-10-0266-01 and 18-10-0268-01 now contain data for select 6- and 7-digit North American Product Classification System (NAPCS) series.
The industrial product and raw materials price indexes for February 2022 will be released on March 22, 2022.
For more information, or to enquire about the concepts, methods or data quality of this release, contact us (toll-free 1-800-263-1136; 514-283-8300; infostats@statcan.gc.ca) or Media Relations (statcan.mediahotline-ligneinfomedias.statcan@statcan.gc.ca).
* All content is copyrighted by Industry Intelligence, or the original respective author or source. You may not recirculate, redistrubte or publish the analysis and presentation included in the service without Industry Intelligence's prior written consent. Please review our terms of use.


