OTTAWA
,
May 23, 2023
(press release)
–
Prices of products manufactured in Canada, as measured by the Industrial Product Price Index (IPPI), fell 0.2% month over month in April, and were 3.5% lower than April 2022. Prices of raw materials purchased by manufacturers operating in Canada, as measured by the Raw Materials Price Index (RMPI), rose 2.9% on a monthly basis in April 2023 and fell 10.8% year over year. Chart 1: Prices for industrial products decline Industrial Product Price Index Prices for energy and petroleum products fell 2.1% in April compared with March 2023, a third consecutive monthly decline. Compared with April 2022, prices were down 20.5%. Prices fell month over month in April 2023 for diesel fuel (-8.7%), jet fuel (-7.5%) and light fuel oils (-10.2%). Prices for these products fell despite a 5.3% increase in the price of conventional crude oil. The monthly price decline in diesel fuel was partially attributable to lower seasonal demand. Meanwhile, the price of finished motor gasoline rose 4.8% partially due to higher seasonal demand in spring, as well as reduced gasoline inventories in the United States. The price of softwood lumber (-4.7%) continued to fall in April, after posting a 7.4% decrease in the previous month. Year over year, prices were down 55.7% in April. Lower lumber prices were partially attributable to cooling housing markets in the United States and Canada amidst rising interest rates. US housing starts were 22.3% lower in April compared with the same month in 2022. Prices for chemicals and chemical products fell 1.0% month over month in April and were 7.6% lower than April 2022. Prices for ammonia and chemical fertilizers fell 9.3% on a monthly basis in April 2023 and were down 39.8% year over year. The decline in prices for fertilizer is partially due to lower prices for natural gas, a key input in fertilizer production. According to the RMPI, the price of natural gas was 36.7% lower in April compared with April 2022. Prices for primary non-ferrous metal products increased 1.8% month over month in April 2023. Prices for unwrought silver and silver alloys (+12.3%) and gold and gold alloys (+3.0%) both rose on a monthly basis. The increase was in part due to investors opting for the safe-haven metals in response to a pessimistic economic outlook. Prices for some industrial metals fell in April. Prices for unwrought aluminum and aluminum alloys (-2.1%) as well as copper and copper alloys (-2.0%) both fell on a monthly basis in April. These declining prices were partially attributable to contracting Chinese manufacturing activity in April. According to data from the Chinese National Bureau of Statistics, the manufacturing purchasing managers' index (PMI) declined to 49.2 in April compared with 51.9 in March. Prices for meat products manufactured in Canada were up 2.0% month over month in April. On a monthly basis, the price of fresh and frozen pork rebounded 8.2% in April, partially driven by rising seasonal demand, after posting five consecutive months of decreases. Compared with April 2022, pork prices fell 7.8% in April 2023, and prices for pork were 19.3% lower compared with January 2020. Meanwhile, pork and hog supplies were ample going into the second quarter of 2023. The price of fresh and frozen beef and veal rose 1.4% month over month in April, and was 15.6% higher than April 2022. Beef prices have been trending higher since November 2022, partially due to tight domestic supply along with strong demand from abroad. On a yearly basis, cattle on feed inventories shrank in both Canada and the United States in April 2023. In March 2023, the value of Canadian beef exports to the United States increased 11.4% on a monthly basis. Chart 2: Softwood lumber (except tongue and groove and other edge worked lumber) Raw Materials Price Index Prices for crude energy products increased 4.4% in April, mainly on higher prices for conventional crude oil (+5.3%). The price of crude oil jumped at the start of April in response to an announcement by OPEC+ to cut production by 1 million barrels per day. As of the third week of May, those price gains were erased, mostly due to pessimism about global economic growth. Prices for crop products declined 1.8% in April, mainly on lower prices for canola (-3.1%) and other crop products (-1.8%). Crop product pricing has been generally trending downward since June 2022. Year over year, prices for crop products decreased 19.0%. Ongoing ample supply played a part in lower canola prices. At the end of March 2023, domestic canola stocks increased by 15.3% year over year to 6.0 million tonnes. Chart 3: Prices for raw materials rise Note to readers With each release, data for the previous six months may have been revised. The indexes are not seasonally adjusted. The IPPI reflects the prices that producers in Canada receive as goods leave the plant gate. The IPPI does not reflect what the consumer pays. Unlike the Consumer Price Index, the IPPI excludes indirect taxes and all costs that occur between the time a good leaves the plant and the time the final user takes possession of the good. This includes transportation, wholesale and retail costs. Canadian producers export many goods. Canadian producers often indicate goods' prices in foreign currencies, especially in US dollars, which are then converted into Canadian dollars. This is particularly the case for motor vehicles, pulp and paper products, and wood products. Therefore, fluctuations in the value of the Canadian dollar against its US counterpart affect the IPPI. However, the conversion to Canadian dollars reflects only how respondents provide their prices. This is not a measure that takes into account the full effect of exchange rates. The conversion of prices received in US dollars is based on the average monthly exchange rate established by the Bank of Canada and available in Table 33-10-0163-01 (series v111666275). Monthly and annual variations in the exchange rate, as described in the release, are calculated according to the indirect quotation of the exchange rate (for example, CAN$1 = US$X). The RMPI reflects the prices paid by Canadian manufacturers for key raw materials. Many of those prices are set on the world market. However, as few prices are denominated in foreign currencies, their conversion into Canadian dollars has only a minor effect on the calculation of the RMPI. Products The video "Producer price indexes" is available on the Statistics Canada Training Institute webpage. It introduces Statistics Canada's producer price indexes—what they are, how they are made and what they are used for. Increased sample size for certain series Next release Contact information Industry Intelligence Editor's Note: This press release omits select charts and/or marketing language for editorial clarity. Click here to view the full report.
In April, the IPPI fell 0.2% month over month and decreased 3.5% on a year-over-year basis.
In April, the RMPI rose 2.9% on a monthly basis and fell 10.8% year over year.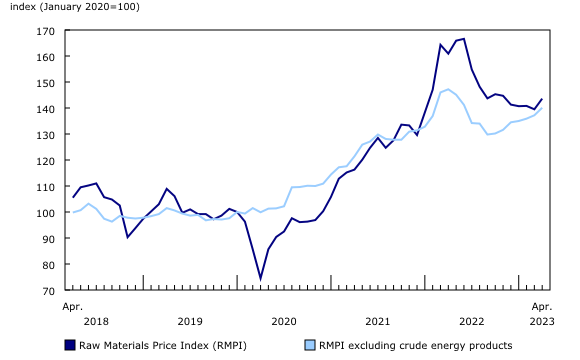
The Industrial Product Price Index (IPPI) and the Raw Materials Price Index (RMPI) are available at the Canadian level only. Selected commodity groups within the IPPI are also available by region.
Statistics Canada launched the Producer Price Indexes Portal as part of a suite of portals for prices and price indexes. This webpage provides Canadians with a single point of access to a variety of statistics and measures related to producer prices.
Effective with the release of April 2023 data, the sample size for certain IPPI and RMPI indexes has been increased to improve their quality. The complete list of these indexes can be obtained upon request.
The industrial product and raw materials price indexes for May will be released on June 19.
For more information, or to enquire about the concepts, methods or data quality of this release, contact us (toll-free 1-800-263-1136; 514-283-8300; infostats@statcan.gc.ca) or Media Relations (statcan.mediahotline-ligneinfomedias.statcan@statcan.gc.ca).
* All content is copyrighted by Industry Intelligence, or the original respective author or source. You may not recirculate, redistrubte or publish the analysis and presentation included in the service without Industry Intelligence's prior written consent. Please review our terms of use.


