OTTAWA
,
January 5, 2024
(press release)
–
Employment was virtually unchanged (+0.0%) in December, and the unemployment rate held steady at 5.8%. The employment rate fell 0.2 percentage points to 61.6%, as the population aged 15 and older grew by 74,000 (+0.2%). Among core-aged men (aged 25 to 54), employment rose by 25,000 (+0.4%). Employment also rose among young women aged 15 to 24 (+13,000; +1.0%) but declined among men aged 55 and older (-27,000; -1.1%). There were more people employed in professional, scientific and technical services (+46,000; +2.4%), health care and social assistance (+16,000; +0.6%) and "other services" (which includes personal and repair services) (+12,000; +1.5%) in December. There were declines in five industries, led by wholesale and retail trade (-21,000; -0.7%) and manufacturing (-18,000; -1.0%). Employment increased in four provinces in December, led by British Columbia (+18,000; +0.6%), while it declined in Ontario (-48,000; -0.6%). Total hours worked rose 0.4% in December and were up 1.7% on a year-over-year basis. On a year-over-year basis, average hourly wages rose 5.4% (+$1.78 to $34.45) in December, following an increase of 4.8% in November (not seasonally adjusted). Employment virtually unchanged in December The population aged 15 and older in the Labour Force Survey (LFS) grew by 74,000 (+0.2%) in December, on par with the average monthly population growth in 2023 (+79,000 per month). The employment rate—the proportion of the population aged 15 and older who are employed—fell 0.2 percentage points to 61.6% in December, the fifth decline in the past six months. The employment rate has trended down in 2023, as population growth generally outpaced employment gains. In December, the employment rate (61.6%) was down 0.9 percentage points from its recent high of 62.5% recorded in January 2023. Chart 1: Employment rate falls for a third consecutive month in December Employment rates decrease in 2023 for core-aged men and women From January to December, the employment rate fell for the core-aged population, as the rate of population growth for this age group (+2.9%; +446,000) outpaced employment growth (+1.9%; +243,000). For women in this age group, the employment rate fell 0.8 percentage points from a record high of 82.2% in January to reach 81.4% in December. For men aged 25 to 54, the rate declined in the latter half of 2023, down 0.8 percentage points from June (88.2%) to December (87.4%). Despite recent labour market cooling, employment rates remained above the average observed from 2017 to 2019, prior to the COVID-19 pandemic, for both core-aged women (+2.1 percentage points) and core-aged men (+0.9 percentage points). Employment for young women aged 15 to 24 rose by 13,000 (+1.0%) in December 2023, while it was virtually unchanged for young men. From January to December, the employment rate for youth fell more steeply compared with the other major demographic groups. For female youth, the rate was down 4.0 percentage points to 56.7%, while for their male counterparts, it declined 2.1 percentage points to 56.0%. In December, employment rates were below their averages observed from 2017 to 2019 for both female (-2.4 percentage points) and male (-1.4 percentage points) youth. Employment among men aged 55 and older fell by 27,000 (-1.1%) in December 2023, the first significant decline since February 2023. For women aged 55 and older, employment was little changed for the fourth consecutive month. The employment rates for this age group were similar to those observed at the beginning of 2023 for both men (40.2% in December) and women (30.4% in December). Unemployment rate holds steady, participation rate declines The unemployment rate generally trended up from April to December for all major demographic groups, with the biggest increase among youth aged 15 to 24 (+1.7 percentage points to 11.3%), followed by people aged 55 and older (+1.1 percentage points to 5.0%). For those in the core-aged group of 25 to 54, the unemployment rate was up by 0.5 percentage points over this period for both women (4.7%) and men (5.0%). The participation rate—the number of employed and unemployed people as a percentage of the population aged 15 and older—fell in December (-0.2 percentage points) to 65.4%. This was down from a recent peak of 65.7% in June. Most of the decline from June to December was attributable to a drop in the youth participation rate, which decreased 2.1 percentage points to 63.5% over the period. On a year-over-year basis, the labour force participation rate fell 3.3 percentage points to 85.4% among youth who were not attending school, while it declined 1.0 percentage points to 46.4% among youth who were students (not seasonally adjusted). The participation rate held steady among those in the core-aged group (88.7%) and among people aged 55 years and older (36.9%), compared with June 2023 and compared with December 2022. Chart 2: Unemployment rate unchanged in December, up 0.8 percentage points from April Employment rises in professional, scientific and technical services Following four months of little change, employment in health care and social assistance rose by 16,000 (+0.6%) in December, building on increases in June (+21,000) and July (+25,000). On a year-over-year basis, employment in health care and social assistance was up by 124,000 (+4.8%) in December. According to the most recent data from the Job Vacancy and Wage Survey, the job vacancy rate in healthcare and social assistance was 5.3% in October 2023, down from a peak of 6.3% in April, but still the highest rate across all sectors. For a third consecutive month, employment fell in wholesale and retail trade (-21,000; -0.7%) in December. From August to December, employment in the industry decreased by 80,000 (-2.7%). This followed gains from December 2022 to August 2023, when employment increased by 108,000 (+3.7%). Chart 3: Employment rises in three industries, led by professional, scientific and technical services Employment up in four provinces in December, while Ontario records a decline Following an increase in September 2023 and little change in October and November, employment in British Columbia rose by 18,000 (+0.6%) in December. The employment rate was 62.0%, up 0.3 percentage points in the month, but little changed on a year-over-year basis. Despite the increase in employment, there were also more people searching for work and the unemployment rate rose 0.3 percentage points to 5.6% in December. After five months of little change, employment in Ontario decreased by 48,000 (-0.6%) in December. The employment rate in the province fell from a recent peak of 62.3% in April to 60.8% in December, as employment was virtually unchanged (-15,000; -0.2%) over this period, while the population aged 15 and older was up by 289,000 (+2.3%). The unemployment rate in Ontario was 6.3% in December, up 0.2 percentage points from November and up 1.4 percentage points from April. Employment in Quebec was little changed for the second consecutive month in December. As fewer people looked for work, the unemployment rate fell 0.5 percentage points to 4.7%, partly offsetting the increase of 0.8 percentage points observed in October and November. On a year-over-year basis, employment in Quebec was up by 1.5% (+65,000) in December, while the employment rate was little changed (61.8% in December 2023, compared with 62.0% in December 2022). Map 1: Unemployment rate by province and territory, December 2023 In Quebec, more than one-third of public sector employees working in educational services lost work hours due to a strike Among all employees in Quebec, an estimated 162,000 (4.0%) lost work hours because they were on strike during the December 2023 LFS reference period (December 3 to 9). Public sector employees working in educational services were most likely to be affected; more than one-third (36.1% or 108,000) lost work hours because they were on strike in December 2023. The majority (78.7%, or 85,000) were women. In the spotlight: Unemployment rates increase for most racialized population groups in 2023 As the tightness of the labour market eased in 2023, the unemployment rate increased for most racialized groups. From December 2022 to December 2023, the unemployment rate rose 1.6 percentage points to 8.5% for core-aged Black Canadians (aged 25 to 54). This was attributable to a rise among core-aged men (+2.8 percentage points to 9.2%), as the unemployment rate held steady for core-aged women (7.8%) (three-month moving averages, not seasonally adjusted). Among Black Canadian youth, the unemployment rate increased 4.4 percentage points from December 2022 to December 2023, when it stood at 17.5%. This compared with a year-over-year increase in December 2023 of 1.2 percentage points (to 10.6%) for the total youth population (three-month moving averages, not seasonally adjusted). For South Asian Canadians aged 25 to 54, the unemployment rate rose 0.8 percentage points from December 2022 to December 2023 to reach 5.7%. The rate was up for core-aged women (+0.9 percentage points to 6.8%), while it was little changed for core-aged men (4.8%). The rate for South Asian Canadian youth held steady for both male and female youth (10.9% overall) and was comparable to the unemployment rate for all youth (10.6%) (three-month moving averages, not seasonally adjusted). The unemployment rate for core-aged Chinese Canadians was 5.1% in December 2023, little changed from 12 months earlier. The rate held steady for both core-aged women (5.3%) and men (4.9%). The rate for youth was little changed at 13.9%, and was higher than the Canadian average for youth (10.6%) (three-month moving averages, not seasonally adjusted). In the spotlight: The number of Canadians providing app-based ride or delivery services grows in 2023 Based on data from the December 2023 LFS supplement, 135,000 Canadians aged 16 to 69 provided ride or taxi services (e.g., personal transport) through apps or platforms in the 12 previous months, an increase of 48.1% (+44,000) compared with 2022. The number of Canadians who provided delivery services through an app or platform was also up from 2022 to 2023, rising by 45,000 (+19.2%) to reach 272,000. In line with the pattern observed in 2022, half (49.9%) of those who had provided personal transport or delivery services in 2023 were living in the three largest census metropolitan areas of Toronto, Montréal and Vancouver. Landed immigrants accounted for nearly 6 in 10 (57.5%) of the 365,000 people who provided either personal transport or delivery services through an app or platform in the 12 months ending in December 2023. In comparison, the proportion was 53.4% for the 12 months ending in December 2022. The majority of personal transport and delivery service workers also belonged to racialized groups (70.5%), with South Asian (30.2%) and Black (10.3%) Canadians accounting for the largest proportions of these workers. Note to readers The LFS estimates are based on a sample and are therefore subject to sampling variability. As a result, monthly estimates will show more variability than trends observed over longer time periods. For more information, see "Interpreting Monthly Changes in Employment from the Labour Force Survey." This analysis focuses on differences between estimates that are statistically significant at the 68% confidence level. LFS estimates at the Canada level do not include the territories. The LFS estimates are the first in a series of labour market indicators released by Statistics Canada, which includes indicators from programs such as the Survey of Employment, Payrolls and Hours (SEPH); Employment Insurance Statistics; and the Job Vacancy and Wage Survey. For more information on the conceptual differences between employment measures from the LFS and those from the SEPH, refer to section 8 of the Guide to the Labour Force Survey (Catalogue number71-543-G). Face-to-face personal interviewing resumed in November 2022. Telephone interviews continued to be conducted by interviewers working from their homes rather than Statistics Canada's call centres, as they have since March 2020. About 48,000 interviews were completed in December and in-depth data quality evaluations conducted each month confirm that the LFS continues to produce an accurate portrait of Canada's labour market. The employment rate is the number of employed people as a percentage of the population aged 15 and older. The rate for a particular group (for example, youths aged 15 to 24) is the number employed in that group as a percentage of the population for that group. The unemployment rate is the number of unemployed people as a percentage of the labour force (employed and unemployed). The participation rate is the number of employed and unemployed people as a percentage of the population aged 15 and older. Full-time employment consists of persons who usually work 30 hours or more per week at their main or only job. Part-time employment consists of persons who usually work less than 30 hours per week at their main or only job. Total hours worked refers to the number of hours actually worked at the main job by the respondent during the reference week, including paid and unpaid hours. These hours reflect temporary decreases or increases in work hours (for example, hours lost due to illness, vacation, holidays or weather; or more hours worked due to overtime). In general, month-to-month or year-to-year changes in the number of people employed in an age group reflect the net effect of two factors: (1) the number of people who changed employment status between reference periods, and (2) the number of employed people who entered or left the age group (including through aging, death or migration) between reference periods. Information on racialized groups Seasonal adjustment Population growth in the Labour Force Survey The LFS target population includes temporary residents—that is, those with a valid work or study permit, their families, and refugee claimants—as well as permanent residents (landed immigrants) and the Canadian-born. Information gathered from LFS respondents is weighted to represent the survey target population using population calibration totals. These totals are updated each month, using the most recently available information on population changes, including changes in the number of non-permanent residents. LFS population calibration totals are derived from Canada's official population estimates using similar sources and methods, with minor adjustments being made to reflect exclusions from the LFS target population. Revisions to seasonally-adjusted Labour Force Survey tables Next release Products The product "Labour Force Survey in brief: Interactive app" (Catalogue number14200001) is also available. This interactive visualization application provides seasonally adjusted estimates by province, sex, age group and industry. The product "Labour Market Indicators, by province and census metropolitan area, seasonally adjusted" (Catalogue number71-607-X) is also available. This interactive dashboard provides customizable access to key labour market indicators. The product "Labour Market Indicators, by province, territory and economic region, unadjusted for seasonality" (Catalogue number71-607-X) is also available. This dynamic web application provides access to labour market indicators for Canada, provinces, territories and economic regions. The product Labour Force Survey: Public Use Microdata File (Catalogue number71M0001X) is also available. This public use microdata file contains non-aggregated data for a wide variety of variables collected from the Labour Force Survey. The data have been modified to ensure that no individual or business is directly or indirectly identified. This product is for users who prefer to do their own analysis by focusing on specific subgroups in the population or by cross-classifying variables that are not in our catalogued products. Contact information Industry Intelligence Editor's Note: This press release omits select charts and/or marketing language for editorial clarity. Click here to view the full report.
Employment held steady in December (+0.0%), following little change in November (+25,000; +0.1%) and October (+18,000; +0.1%). Employment growth slowed in the second half of 2023, averaging 23,000 per month, compared with the first six months of 2023, when it averaged 48,000 per month.
Employment among core-aged men (aged 25 to 54) increased by 25,000 (+0.4%) in December, following two months of little change. For women in the same age group, employment was virtually unchanged for the third consecutive month.
The unemployment rate held steady at 5.8% in December. This followed increases in five of the previous seven months; from April to November, the rate rose by 0.8 percentage points. In December, there were 1.2 million unemployed people, an increase of 202,000 (+19.3%) compared with 12 months earlier.
Employment in professional, scientific and technical services increased by 46,000 (+2.4%) in December, following little change in the three previous months. This was the second monthly increase in the industry in 2023, the first having been a rise of 52,000 in August. On a year-over-year basis, employment in this industry was up by 78,000 (+4.2%) in December.
Employment rose in British Columbia (+18,000; +0.6%), Nova Scotia (+6,300; +1.3%), Saskatchewan (+4,800; +0.8%), and Newfoundland and Labrador (+2,400; +1.0%) in December, while it declined in Ontario (-48,000; -0.6%). There was little change in the other provinces. For further information on key province and industry level labour market indicators, see "Labour Force Survey in brief: Interactive app."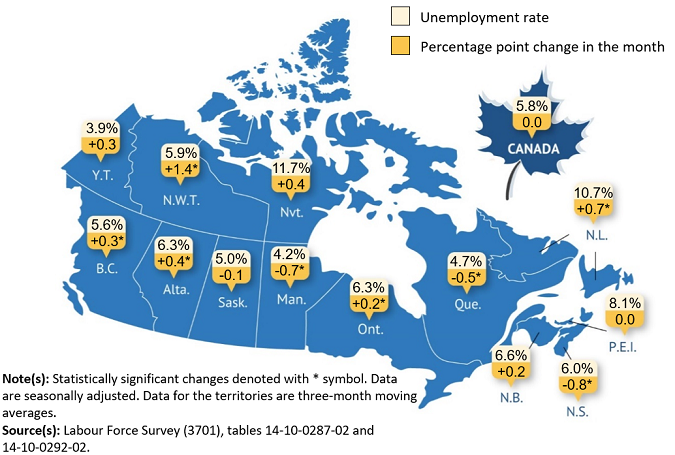
In December, public sector unions across Quebec representing teachers, nurses and other employees in the public sector held widespread strikes which closed schools and disrupted some health services.
Producing labour market indicators for diverse groups, such as racialized populations, is essential to understanding the unique and complex circumstances and experiences of various populations in Canada. In December, people belonging to racialized groups comprised 30.1% of the labour force, up from 28.5% in December 2022 (three-month moving averages, not seasonally adjusted). The largest population group was South Asian Canadians, comprising 8.3% of the labour force. The next two largest groups were Chinese (5.1%) and Black (4.5%) Canadians.
In 2023, digital platforms and apps continued to offer Canadians a convenient way of accessing personal transport and delivery services, while also making it possible for individuals to earn income by performing the associated work activities. These apps or platforms connect drivers and customers and play a significant role in managing service delivery by maintaining a user rating system, assigning clients, and processing payments.
The Labour Force Survey (LFS) estimates for December are for the week of December 3 to 9, 2023.
Data on "racialized groups" are derived from the "visible minority" variable. "Visible minority" refers to whether or not a person belongs to one of the visible minority groups defined by the Employment Equity Act. The Employment Equity Act defines visible minorities as "persons, other than Aboriginal peoples, who are non-Caucasian in race or non-white in colour." The visible minority population consists mainly of the following groups: South Asian, Chinese, Black, Filipino, Latin American, Arab, Southeast Asian, West Asian, Korean and Japanese.
Unless otherwise stated, this release presents seasonally adjusted estimates, which facilitate comparisons by removing the effects of seasonal variations. For more information on seasonal adjustment, see Seasonally adjusted data – Frequently asked questions.
The LFS target population includes all persons aged 15 years and older whose usual place of residence is in Canada, with the exception of those living on reserves, full-time members of the regular Armed Forces and persons living in institutions (including inmates of penal institutions and patients in hospitals and nursing homes).
On January 29, 2024, revised LFS data will be released, as is done every year, resulting in minor changes to recent estimates. Estimates from January 2021 to December 2023 will be republished incorporating a fine-tuning of the parameters used in the seasonal adjustment process.
The next release of the LFS will be on February 9, 2024. January 2024 data will reflect labour market conditions during the week of January 14 to 20, 2024.
More information about the concepts and use of the Labour Force Survey is available online in the Guide to the Labour Force Survey (Catalogue number71-543-G).
For more information, or to enquire about the concepts, methods or data quality of this release, contact us (toll-free 1-800-263-1136; 514-283-8300; infostats@statcan.gc.ca) or Media Relations (statcan.mediahotline-ligneinfomedias.statcan@statcan.gc.ca).
* All content is copyrighted by Industry Intelligence, or the original respective author or source. You may not recirculate, redistrubte or publish the analysis and presentation included in the service without Industry Intelligence's prior written consent. Please review our terms of use.


